

Bitcoin price started a recovery wave from $68,000. BTC is now back above $70,000 and could struggle to stay higher in the short term.
- Bitcoin started a decent recovery wave above $69,500 and $70,000.
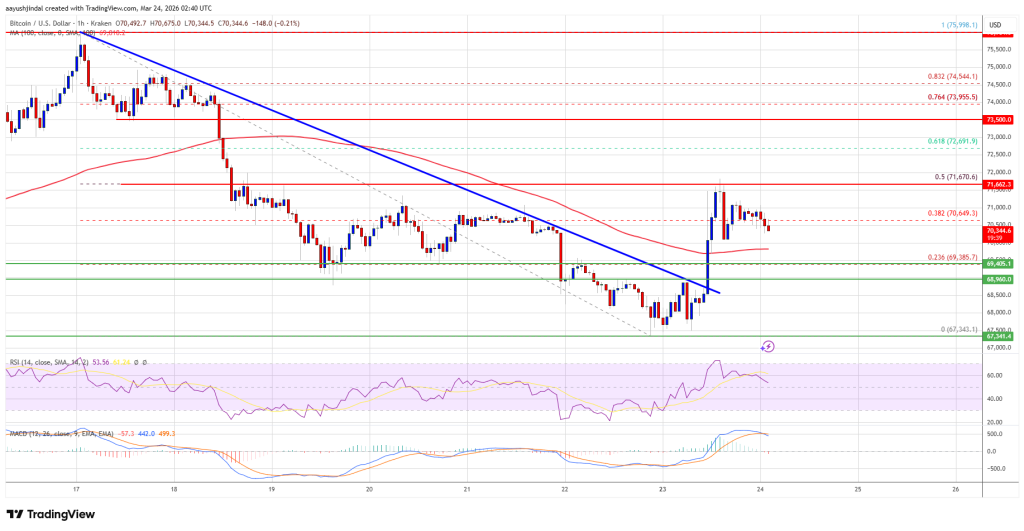
- The price is trading above $70,000 and the 100 hourly moving average.
- There was a break above a bearish trendline with resistance at $69,500 on the hourly chart of the BTC/USD pair (data feed from Kraken).
- The pair could fall again if it remains below the $71,500 and $72,000 levels.
Bitcoin price attempts recovery
Bitcoin price found support near the $67,500 zone and recently started a recovery wave. BTC climbed above the USD 68,800 and USD 69,500 resistance levels.
There was a break above a bearish trendline with resistance at $69,500 on the hourly chart of the BTC/USD pair. The bulls were able to push the price above the 38.2% Fib retracement level of the downward move from the $75,999 swing high to the $67,343 low.
However, the price faced resistance near the $71,500 zone and the 50% Fib retracement level of the downward move from the $75,999 swing high to the $67,343 low. Bitcoin is now trading above $70,000 and the 100 hourly moving average.
If the price remains stable above $70,000, another increase can be attempted. Immediate resistance is near the $71,650 level. The first major resistance is around the $72,000 level. A close above the USD 72,000 resistance could send the price rising further.
In the mentioned case, the price could rise and test the USD 73,500 resistance. Any further gains could send the price towards the USD 74,200 level. The next barrier for the bulls could be $75,000.
Another drop in BTC?
If Bitcoin fails to rise above the USD 71,650 resistance zone, it could trigger another decline. Immediate support is approaching the $70,000 level. The first major support is near the $69,350 level.
The next support is now near the $68,950 zone. Any further losses could send the price towards the USD 68,000 support in the near term. The key support now lies at $67,500, below which BTC could struggle to recover in the near term.
Technical indicators:
Hourly MACD – The MACD is now losing pace in the bullish zone.
Hourly RSI (Relative Strength Index) – The RSI for BTC/USD is now above the 50 level.
Major support levels – $68,950, followed by $68,000.
Major resistance levels – $71,650 and $72,000.