

Bitcoin price started a recovery wave above $69,200. BTC is now back above $70,000 and could be aiming for a steady rise if it clears $71,650.
- Bitcoin started a decent recovery wave above $69,500 and $70,000.
- The price is trading above $70,000 and the 100 hourly moving average.
- A bullish flag pattern is forming with resistance at $70,700 on the hourly chart of the BTC/USD pair (data feed from Kraken).
- The pair could decline again if it stays below the $71,200 and $71,650 levels.
Bitcoin price faces resistance
Bitcoin price started a recovery wave above the USD 68,800 pivot level. BTC climbed above the USD 69,200 and USD 69,500 resistance levels.
The bulls were able to push the price above the 38.2% Fib retracement level of the downward move from the $75,997 swing high to the $67,343 low. The price even climbed above $71,200 before the bears appeared near the $71,650 level.
Bitcoin is now trading above $70,000 and the 100 hourly moving average. If the price remains stable above USD 69,500, a new increase can be attempted. The immediate resistance is near the $70,700 level. A bullish flag pattern is also forming with resistance at $70,700 on the hourly chart of the BTC/USD pair.
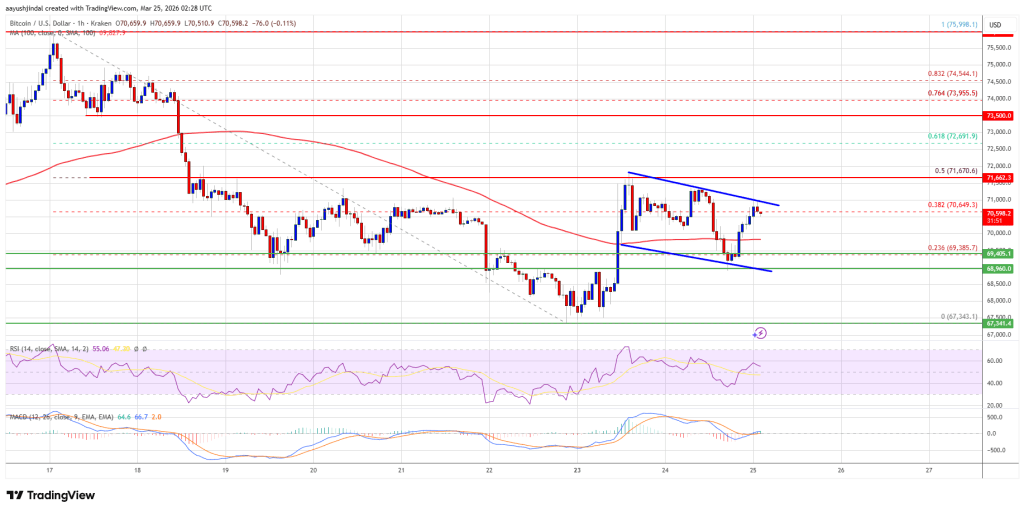
The first major resistance is near the $71,650 level or the 50% Fib retracement level of the downward move from the $75,997 swing high to the $67,343 low. A close above the resistance at $71,650 could send the price higher. In the mentioned case, the price could rise and test the USD 72,500 resistance. Any further gains could send the price towards the USD 73,200 level. The next threshold for the bulls could be $73,500.
Another drop in BTC?
If Bitcoin fails to rise above the USD 71,650 resistance zone, it could trigger another decline. Immediate support is approaching the $70,000 level. The first major support is near the $69,500 level.
The next support is now near the $69,000 zone. Any further losses could send the price towards the USD 68,200 support in the near term. The key support now lies at $67,500, below which BTC could struggle to recover in the near term.
Technical indicators:
Hourly MACD – The MACD is now losing pace in the bullish zone.
Hourly RSI (Relative Strength Index) – The RSI for BTC/USD is now above the 50 level.
Major support levels – USD 69,500, followed by USD 69,000.
Major resistance levels – $70,700 and $71,650.