

Bitcoin price started a new decline from the $78,400 zone. BTC is consolidating and could struggle to stay above the USD 73,500 support.
- Bitcoin failed to stay above $76,500 and corrected gains.
- The price is trading below $75,500 and the 100 hourly moving average.
- A connecting bearish trendline is forming with resistance at $75,600 on the hourly chart of the BTC/USD pair (data feed from Kraken).
- The pair could extend losses if it remains below the USD 75,500 and USD 76,000 levels.
Bitcoin price drops again
Bitcoin price failed to stay above the USD 77,500 resistance zone. BTC reached a high of almost $78,350 and started a new decline. There was a move below the USD 76,500 level.
The price fell below the $75,500 and $75,000 levels. A low was formed at $73,637 and the price is now consolidating losses below the 23.6% Fib retracement level of the downward move from the $78,343 swing high to the $73,637 low.
Bitcoin is now trading below $76,000 and the 100 hourly moving average. If the price remains stable above $73,500, another move up could be attempted. The immediate resistance is near the $74,750 level.
The first major resistance is around the $75,500 level. A connecting bearish trendline is also forming with resistance at $75,600 on the hourly chart of the BTC/USD pair. A close above the USD 75,500 resistance could send the price rising further.
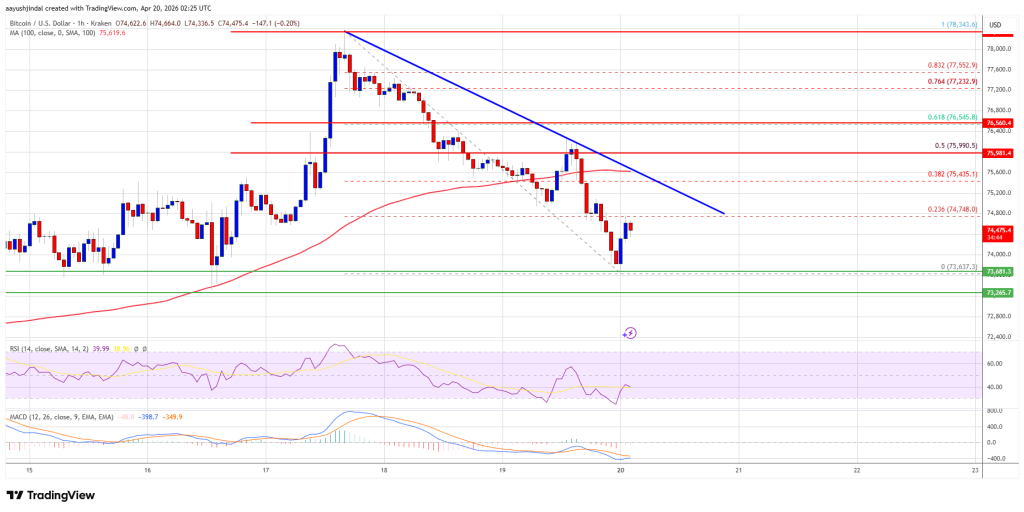
In the said case, the price could rise and test the $76,000 resistance and the 50% Fib retracement level of the downward move from the $78,343 swing high to the $73,637 low. Any further gains could send the price towards the USD 77,200 level. The next barrier for the bulls could be $78,000.
Disadvantage of continuation in BTC?
If Bitcoin fails to rise above the USD 75,500 resistance zone, it could trigger another decline. Immediate support is near the $74,000 level.
The first major support is near the $73,500 level. The next support is now near the $72,500 zone. Any further losses could send the price towards the USD 71,200 support in the short term. The key support is now at $70,000, below which BTC could struggle to recover in the near term.
Technical indicators:
Hourly MACD – The MACD is now gaining speed in the bearish zone.
Hourly RSI (Relative Strength Index) – The RSI for BTC/USD is now below the 50 level.
Major support levels – USD 74,000, followed by USD 73,500.
Major resistance levels – $75,500 and $76,000.