

This article is available in Spanish.
Bitcoin’s price surge from a new all-time high of $108,353 on Tuesday to around $96,000 (down -11.5%) has sparked intense speculation about whether the current bull cycle is nearing its peak. To address the growing uncertainty, Rafael Schultze-Kraft, co-founder of Glassnode, an on-chain analytics provider, issued a thread on X detailing 18 on-chain metrics and models. “Where is the Bitcoin TOP?” Schultze-Kraft asked before laying out his detailed analysis.
Has Bitcoin Reached Its Cycle Top?
1/ MVRV ratio: The MVRV ratio is a long-standing measure of unrealized profitability and compares market value to realized value. Historically, readings above 7 indicated overheating. “Currently it’s hovering around 3 – room to grow,” Schultze-Kraft noted. This indicates that the market, in terms of total unrealized profits, is not yet at levels that previously coincided with macro tops.
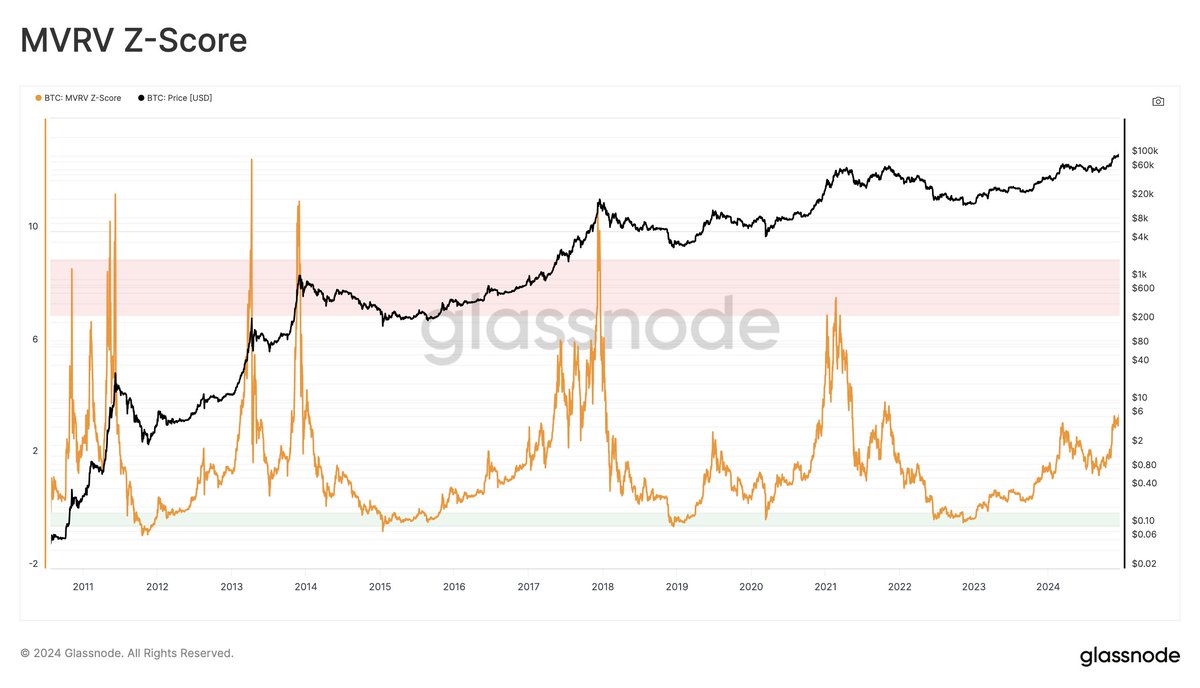
2/ MVRV Price Bands: These bands are derived from the number of days MVRV has spent at extreme levels. Historically, the upper band (3.2) is only exceeded for about 6% of trading days. Today, this top tire equates to a price of $127,000. Considering that Bitcoin is around $98,000, the market has not yet reached a zone that historically marked top formations.
3/ Long-term holders’ profitability (relative unrealized profit and LTH-NUPL): Long-term holders (LTHs) are considered more stable market participants. Their net unrealized gain/loss (NUPL) measure currently stands at 0.75, which Schultze-Kraft calls the “euphoria zone.” He noted that Bitcoin turned another ~3x in the 2021 cycle after reaching similar levels (although he made it clear he doesn’t necessarily expect a repeat). Historical top formations often saw LTH-NUPL values above 0.9. So although the benchmark has increased, it has not yet reached the previous cycle extremes.
Notably, Schultze-Kraft admitted that his observations may be conservative, as the 2021 cycle peaked at slightly lower profitability values than previous cycles. “I expected these profitability numbers to reach slightly higher levels,” he explained. This may indicate decreasing peaks over successive cycles. Investors should be aware that historical extremes may become less pronounced over time.
4/ Annual realized profit/loss ratio: This metric measures the total realized profit compared to the realized losses over the past year. Previous cycle tops showed values above 700%. Currently, there is still “room to grow” at around 580% before it reaches levels historically associated with market tops.
Related reading
5/ Market Cap to Thermocap ratio: An early on-chain metric, comparing Bitcoin’s total market cap to its cumulative mining costs (Thermocap). In previous bull runs, the extremes of the ratio corresponded with the market tops. Schultze-Kraft advises caution with specific target levels, but notes that current levels are not close to previous extremes. The market remains below historical thermocap multiples that indicated past overheating.
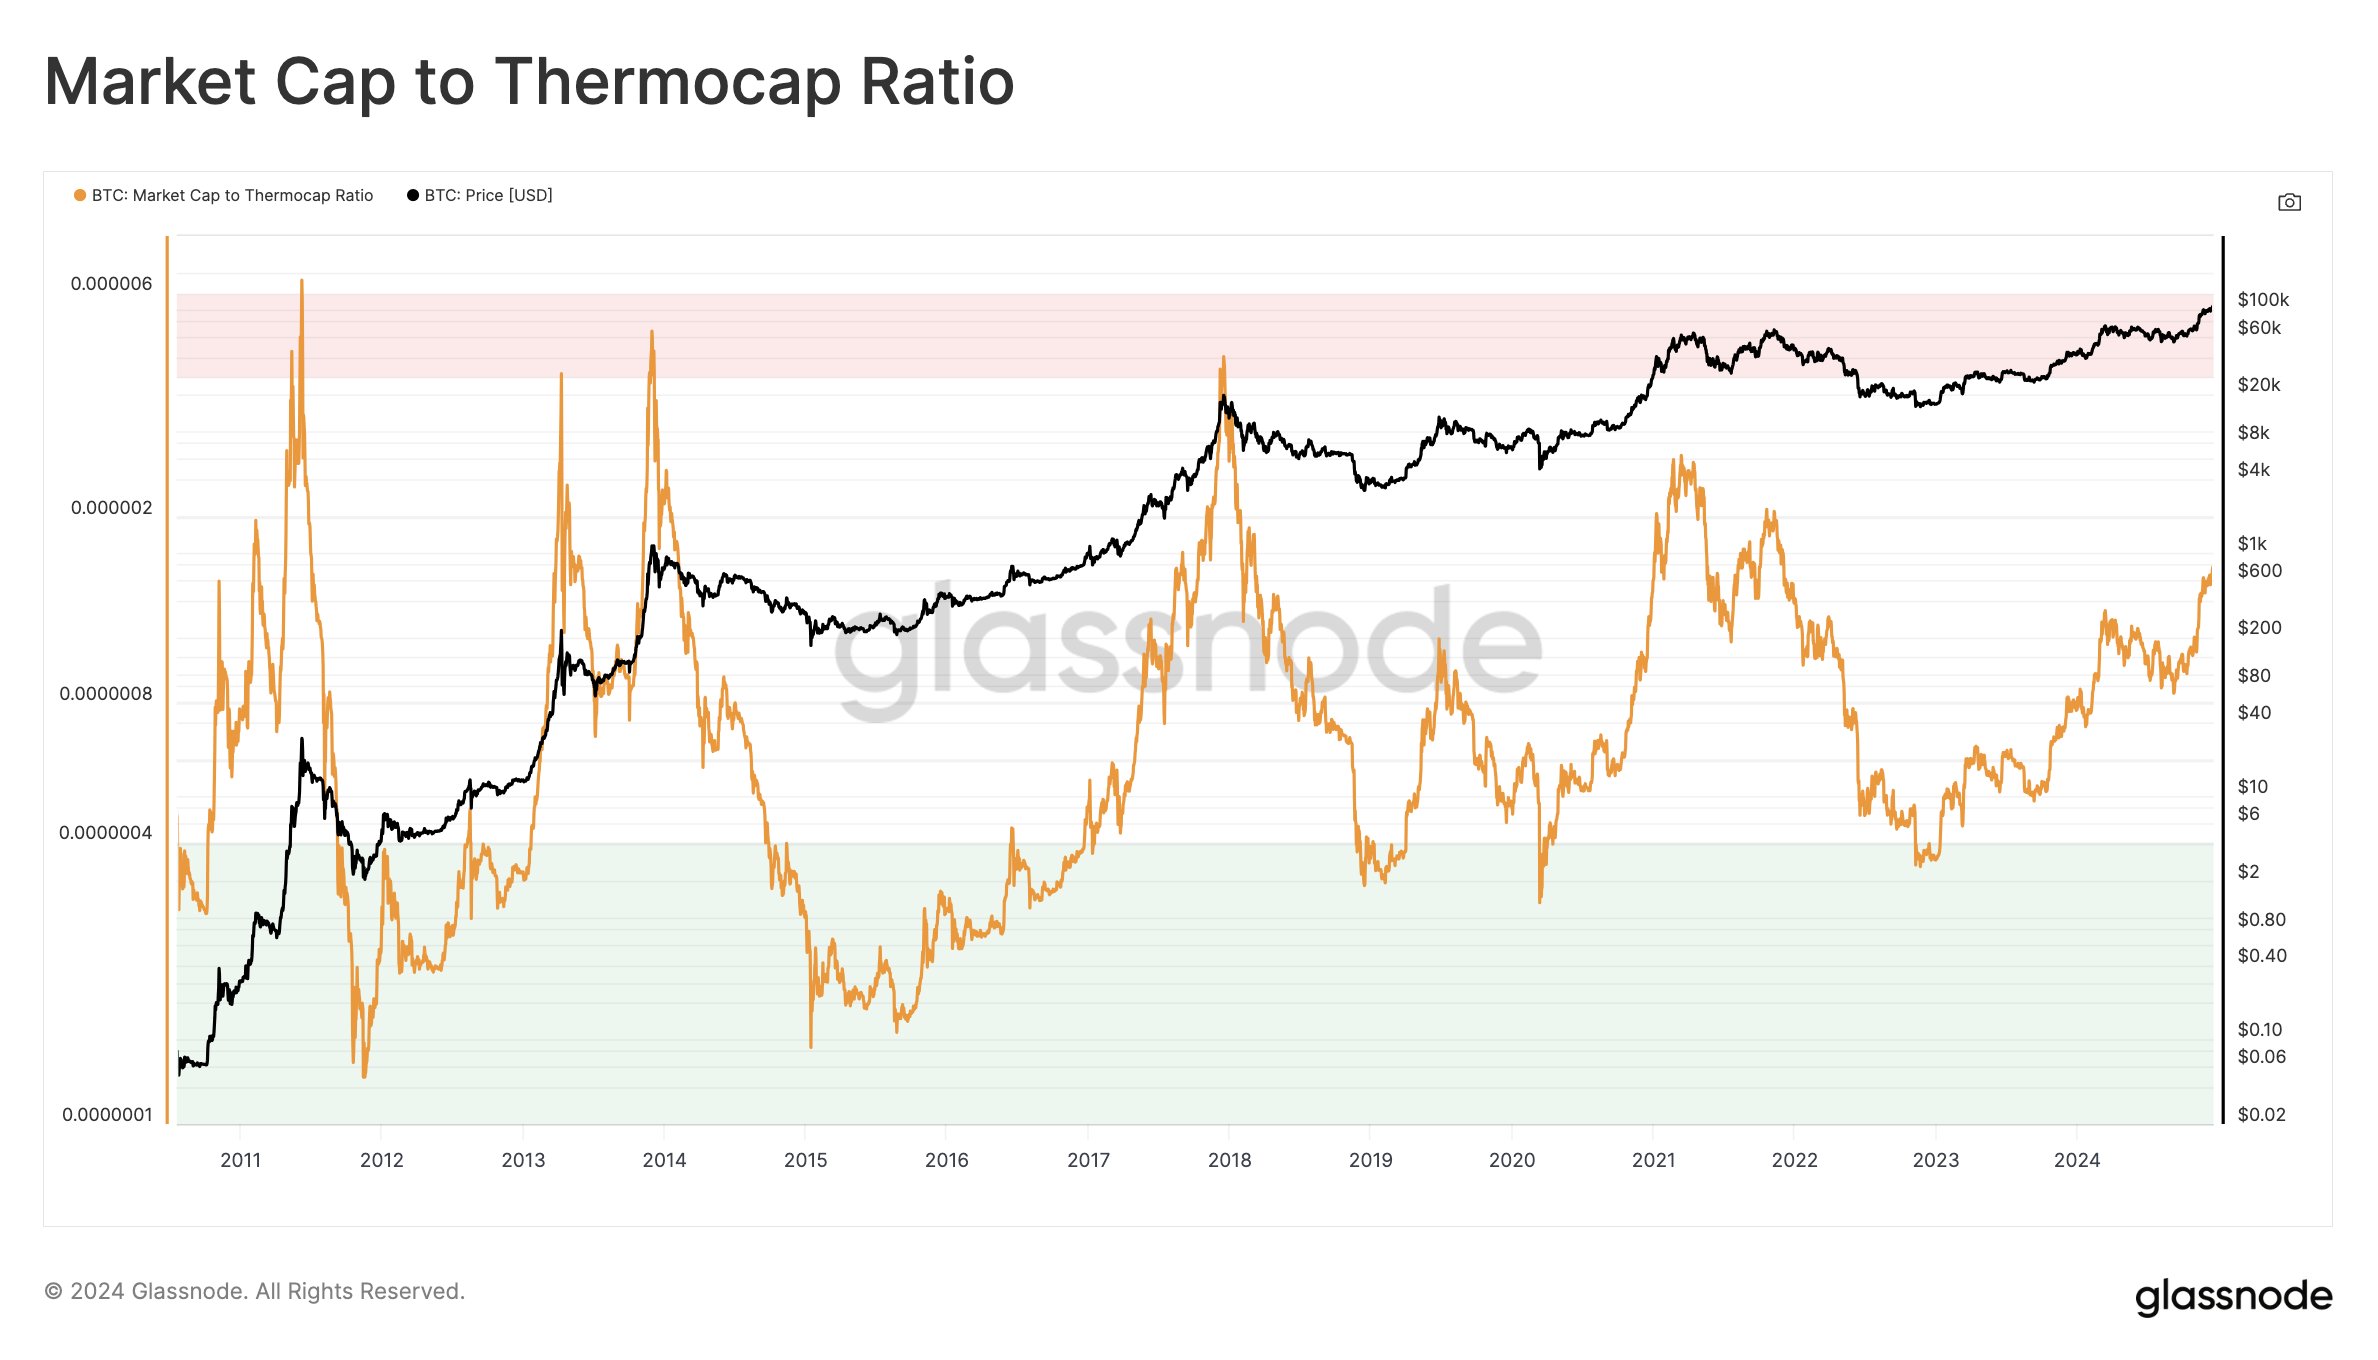
6/ Thermocap multiples (32-64x): Historically, Bitcoin has reached around 32-64 times the Thermocap. “We are at the lower end of this range,” says Schultze-Kraft. Reaching the top band in the current environment would imply a Bitcoin market cap of just above $4 trillion. Given that the current market cap ($1.924 trillion) is significantly lower, this suggests the possibility of substantial upside potential if historical patterns were to hold.
7/ The Investor Tool (2-year SMA x5): The Investor Tool applies a 2-year Simple Moving Average (SMA) of the price and a 5x multiple of that SMA to identify potential top zones. “Which currently amounts to $230,000,” Schultze-Kraft noted. Since the current price of Bitcoin is well below this level, the indicator has not yet given a clear top signal.
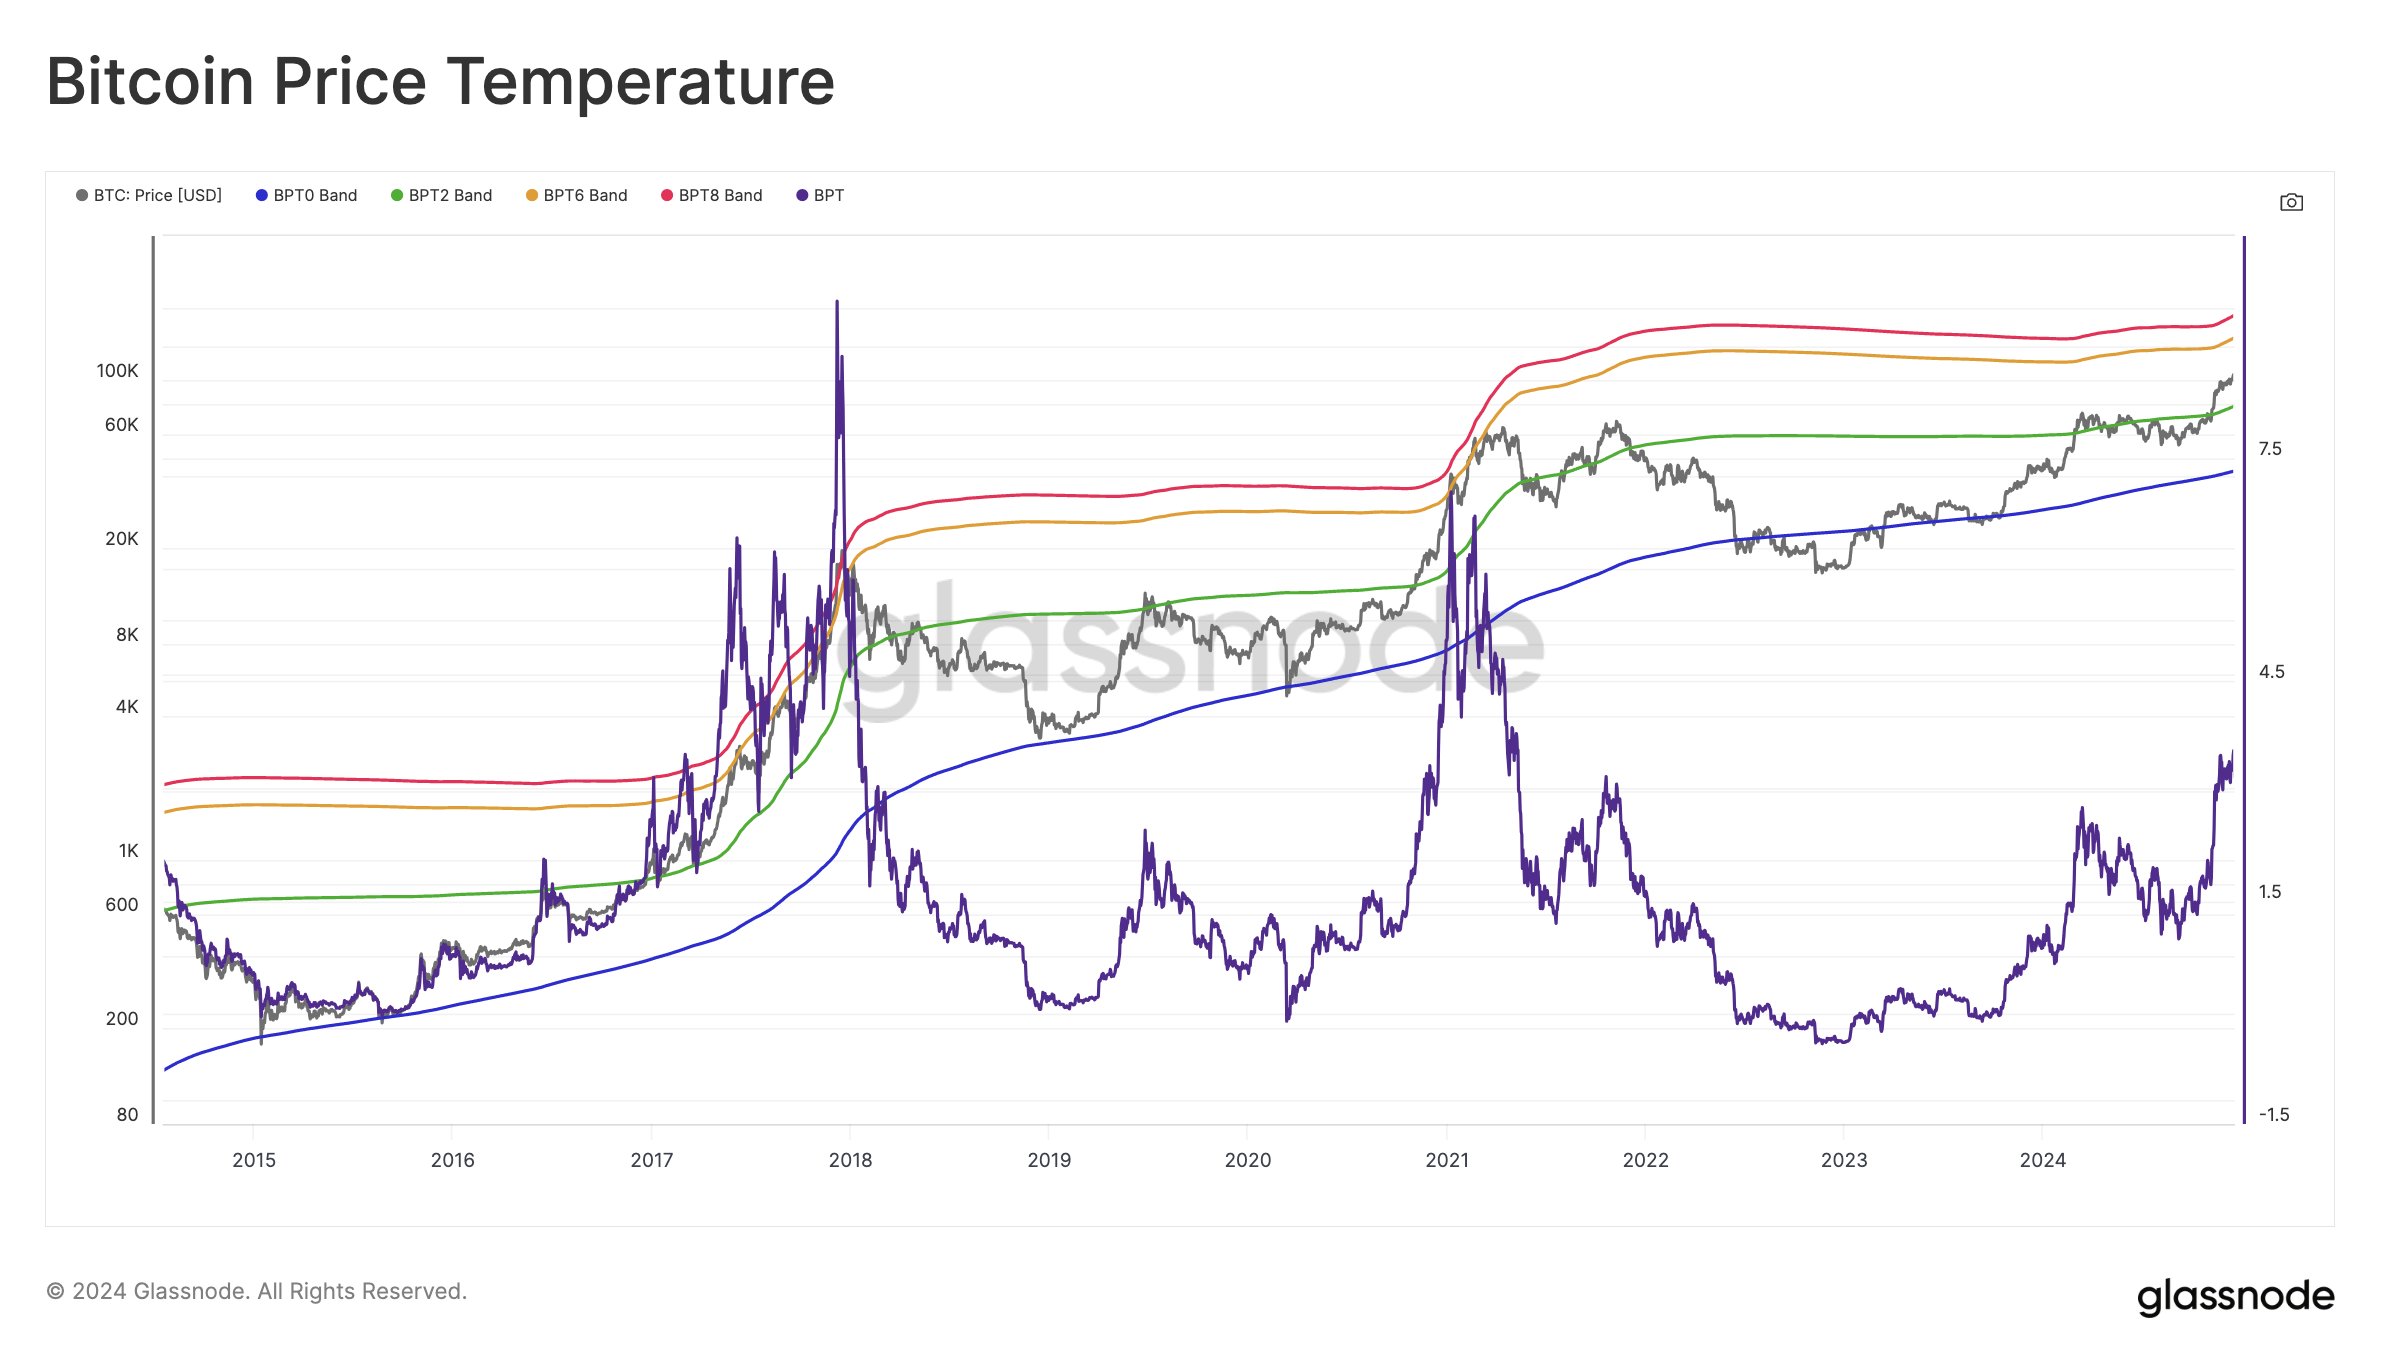
8/ Bitcoin Price Temperature (BPT6): This model uses deviations from a four-year moving average to capture cyclical price extremes. Historically, BPT6 was reached during previous bull markets, and that band now stands at $151,000. With Bitcoin at $98,000, the market is still below the level previously associated with peak overheating.
9/ The True Market Mean & AVIV: The True Market Mean is an alternative cost basis model. The MVRV equivalent, known as AVIV, measures how far the market strays from this average. Historically, peaks have had more than three standard deviations. Today’s equivalent “equates to values above ~2.3”, while the current value is 1.7. “Room to grow,” Schultze-Kraft said, implying that the market has not yet been stretched to its historical extremes by this metric.
Related reading
10/ Low/Mid/Top Cap Models (Delta Cap Derivatives): These models, based on the Delta Cap metric, historically showed reduced values during the 2021 cycle and never reached ‘Top Cap’. Schultze-Kraft urges caution in interpreting this due to evolving market structures. Currently, the mid-cap level is around $4 trillion, about twice the current level. If the market were to follow previous patterns, this would allow for significant growth before reaching the levels typical of previous tops.
11/ Value Days Destroyed Multiple (VDDM): This metric measures the spending behavior of long-held coins compared to the annual average. Historically, extreme values above 2.9 indicated that older coins were hitting the market hard, often during late-stage bull markets. It is currently at 2.2, not yet at extreme levels. “Room to grow,” Schultze-Kraft noted, suggesting not all long-term holders have fully capitulated to profit-taking.
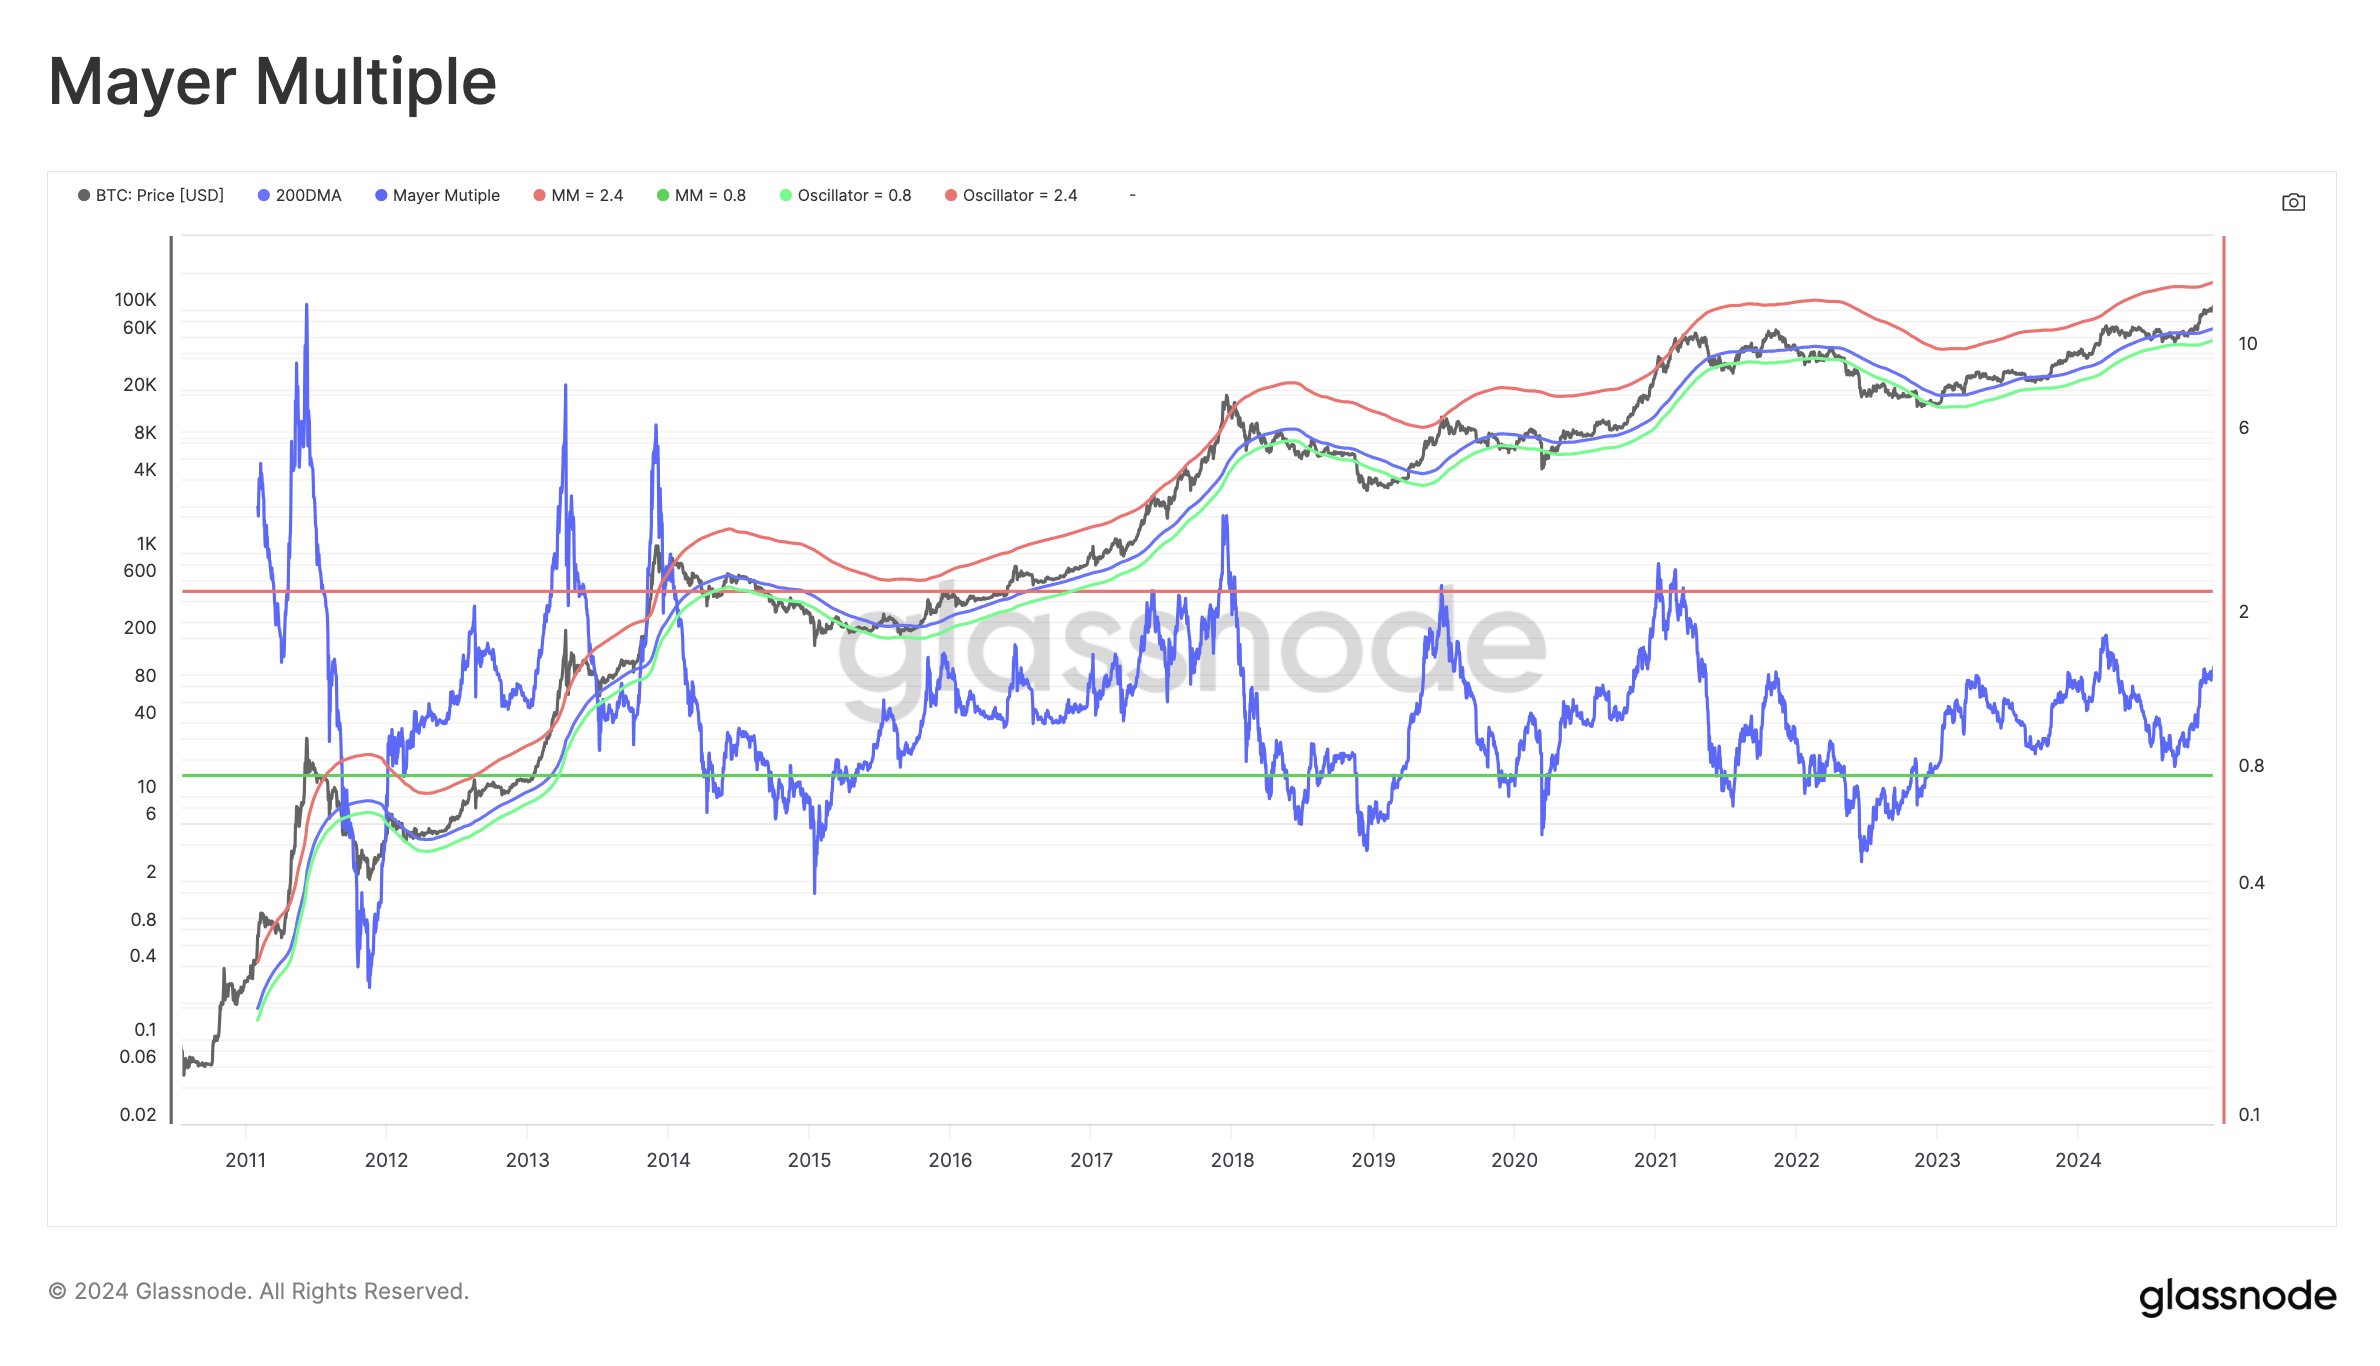
12/ The Mayer Multiple: The Mayer Multiple compares the price to the 200-day SMA. Overbought conditions in previous cycles corresponded to values above 2.4. Currently, a Mayer Multiple above 2.4 would correspond to a price of approximately $167,000. With Bitcoin under $100,000, this threshold remains far away.
13/ The Cycle Extremes Oscillator Chart: This composite uses multiple binary indicators (MVRV, aSOPR, Puell Multiple, Reserve Risk) to identify cycle extremes. “Currently 2/4 is active,” meaning that only half of the monitored conditions for an overheated market are met. Previous tops corresponded to a full range of triggered signals. As such, the graph suggests that the cycle has not yet reached the intensity of a full peak.
14/ Pi Cycle Top Indicator: A price-based signal that has historically identified cycle peaks by comparing short-term and long-term moving averages. “Currently, the short moving average is well below the larger one ($74,000 versus $129,000),” Schultze-Kraft said, indicating that there is no crossover and therefore no classic top signal.
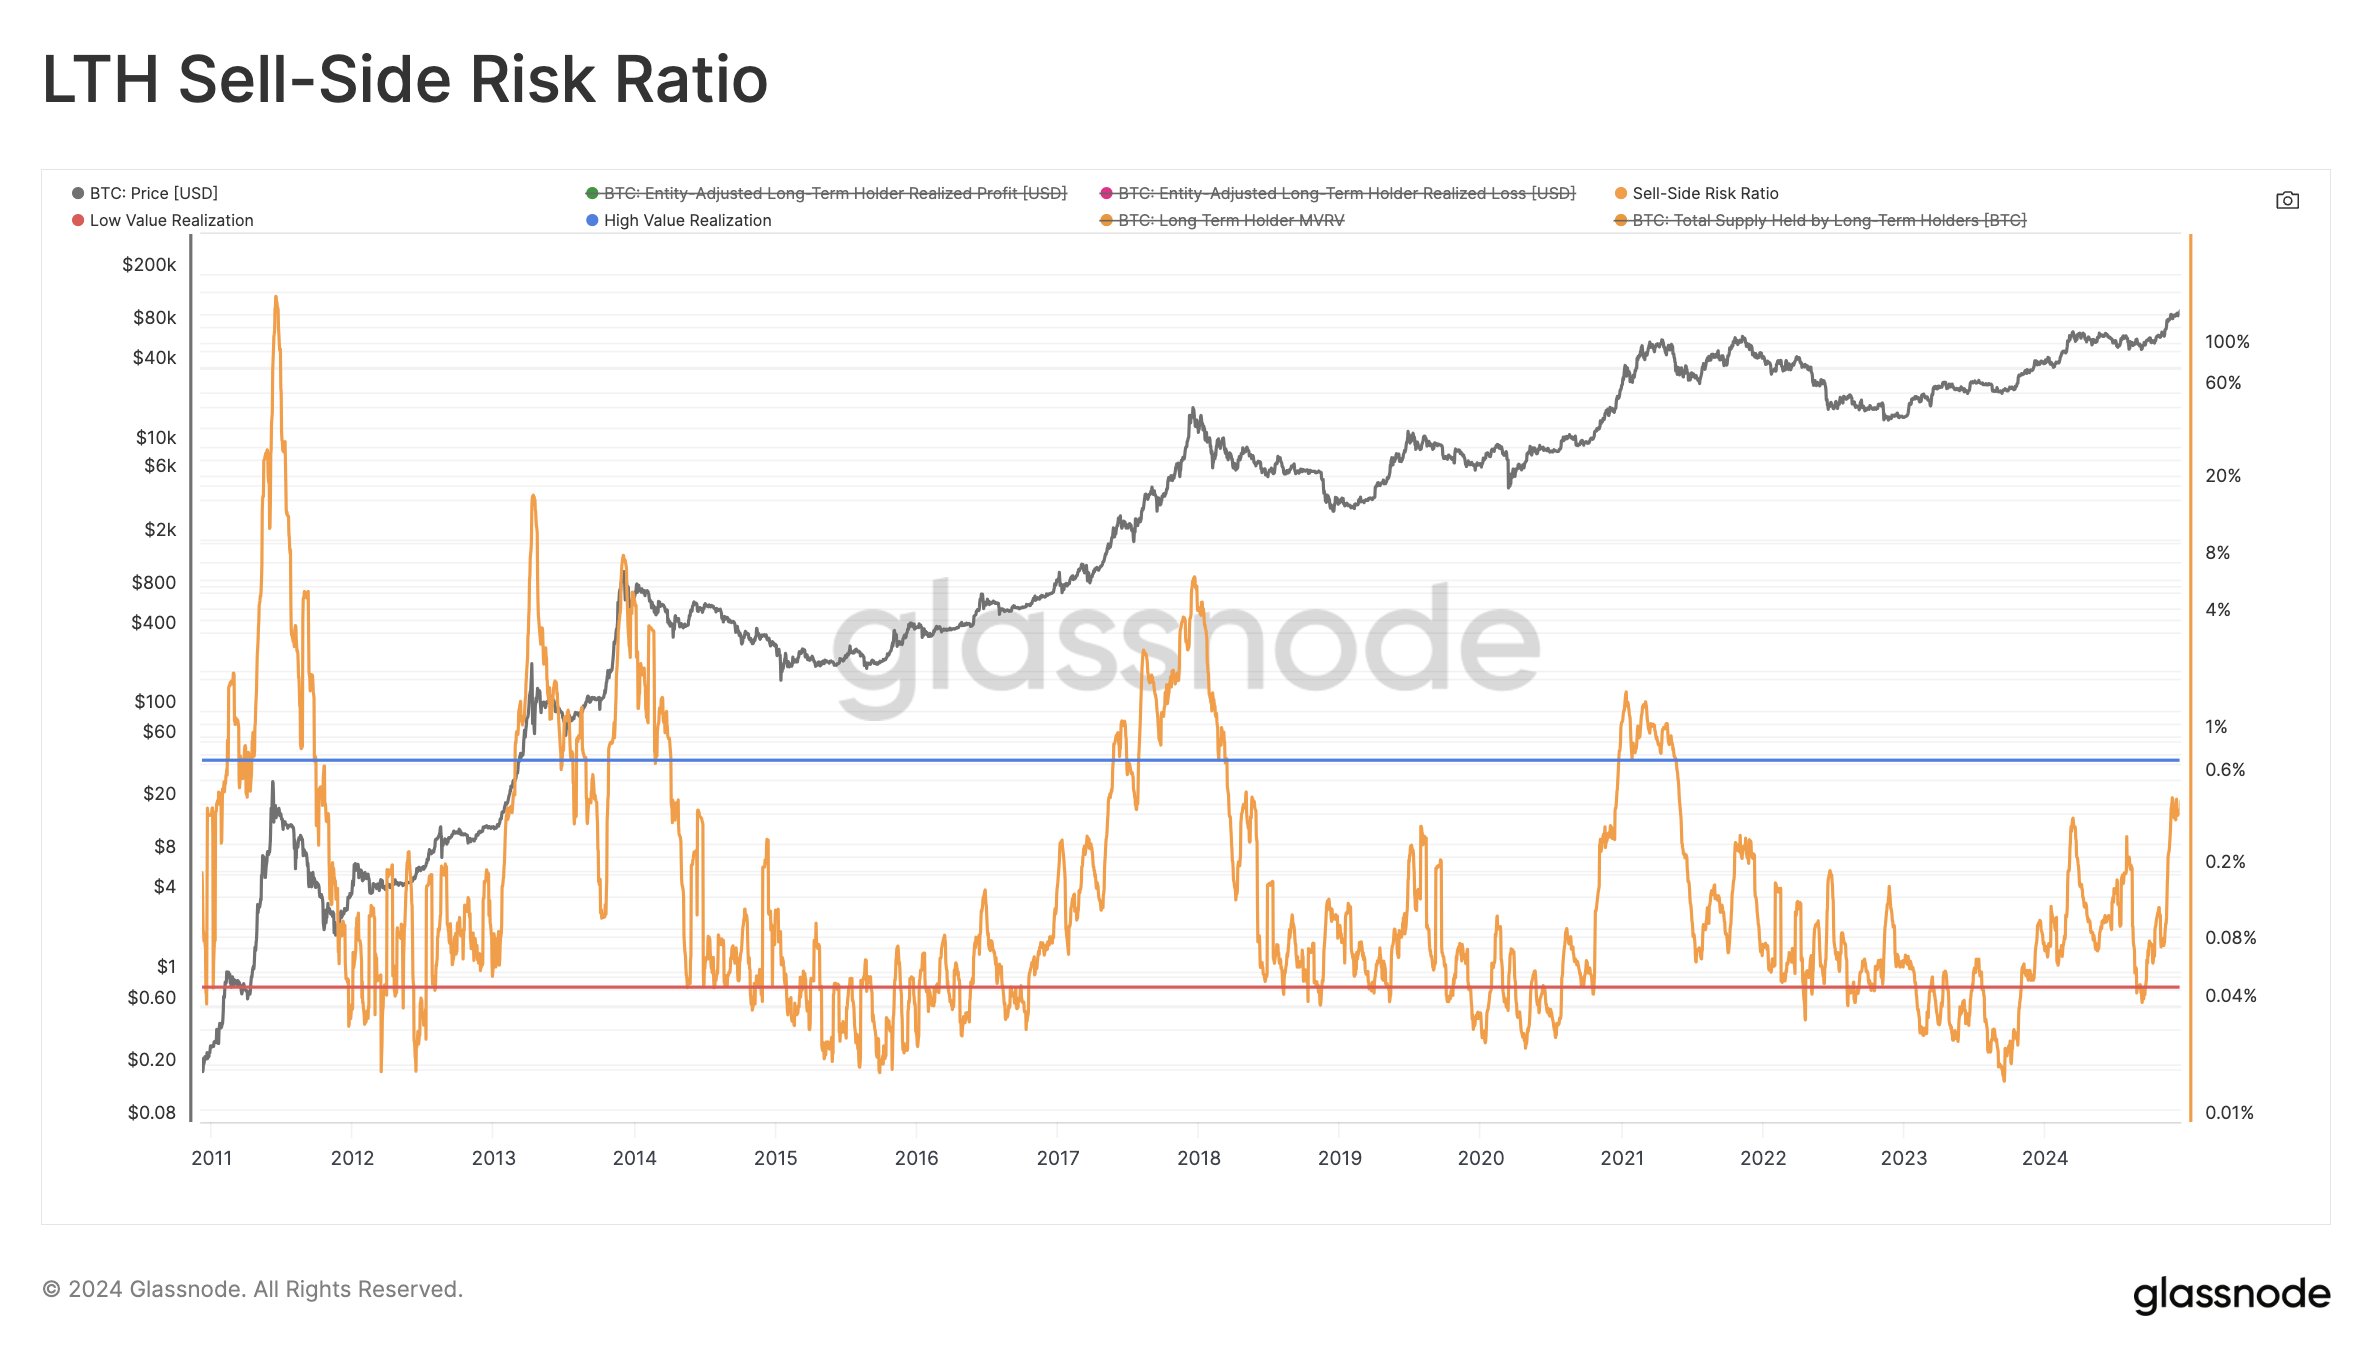
15/ Sell-Side Risk Ratio (LTH version): This ratio compares the total realized gains and losses to the realized market capitalization. High values correlate with late-stage volatile bull markets. “The interesting zone is 0.8% and higher, while we are currently at 0.46% – room to grow,” Schultze-Kraft explains. This implies that, despite recent profit taking, the market has not yet reached the area of intense selling pressure often seen near the top.
16/ LTH Inflation: Schultze-Kraft highlighted long-term holder inflation as “the most bearish chart I have come across yet.” While he didn’t mention specific targets or thresholds in this clip, he said it “screams caution.” Investors should watch this closely as it could signal an increasing payout from long-term holders or other structural headwinds.
17/ STH-SOPR (Short-Term Holder Spent Output Profit Ratio): This metric measures the profit-taking behavior of short-term holders. “Currently elevated, but not sustainable,” Schultze-Kraft noted. In other words, while short-term participants are taking profits, the data does not yet show the kind of sustained, aggressive profit-taking typical of a top market.
18/ SLRV ribbons: these ribbons track trends in realized value in the short and long term. Historically, when both moving averages reach a top and cross, it indicates a market turning point. “Both moving averages are still trending up, but only turning bearish at rounded tops and crossover. There are no indications of a summit at this time,” Schultze-Kraft said.
Overall, Schultze-Kraft emphasized that these metrics should not be used in isolation. “Never rely on single data points – confluence is your friend,” he advised. He acknowledged that this is a non-exhaustive list and that Bitcoin’s evolving ecosystem – now with ETFs, regulatory clarity, institutional adoption and geopolitical factors – may make historical comparisons less reliable. “This cycle may look very different, but (historical) data is all we have,” he concluded.
While numerous figures show the Bitcoin market is moving into more euphoric and profitable territory, few have reached the historic extremes that marked previous cycle tops. Indicators such as MVRV, profitability ratios, thermal metrics and various price-based models generally indicate ‘room to grow’, although at least one of these – LTH inflation – raises some caution. Some composites are only partially activated, while classic top signals such as Pi Cycle Top remain inactive.
At the time of writing, BTC was trading at $96,037.
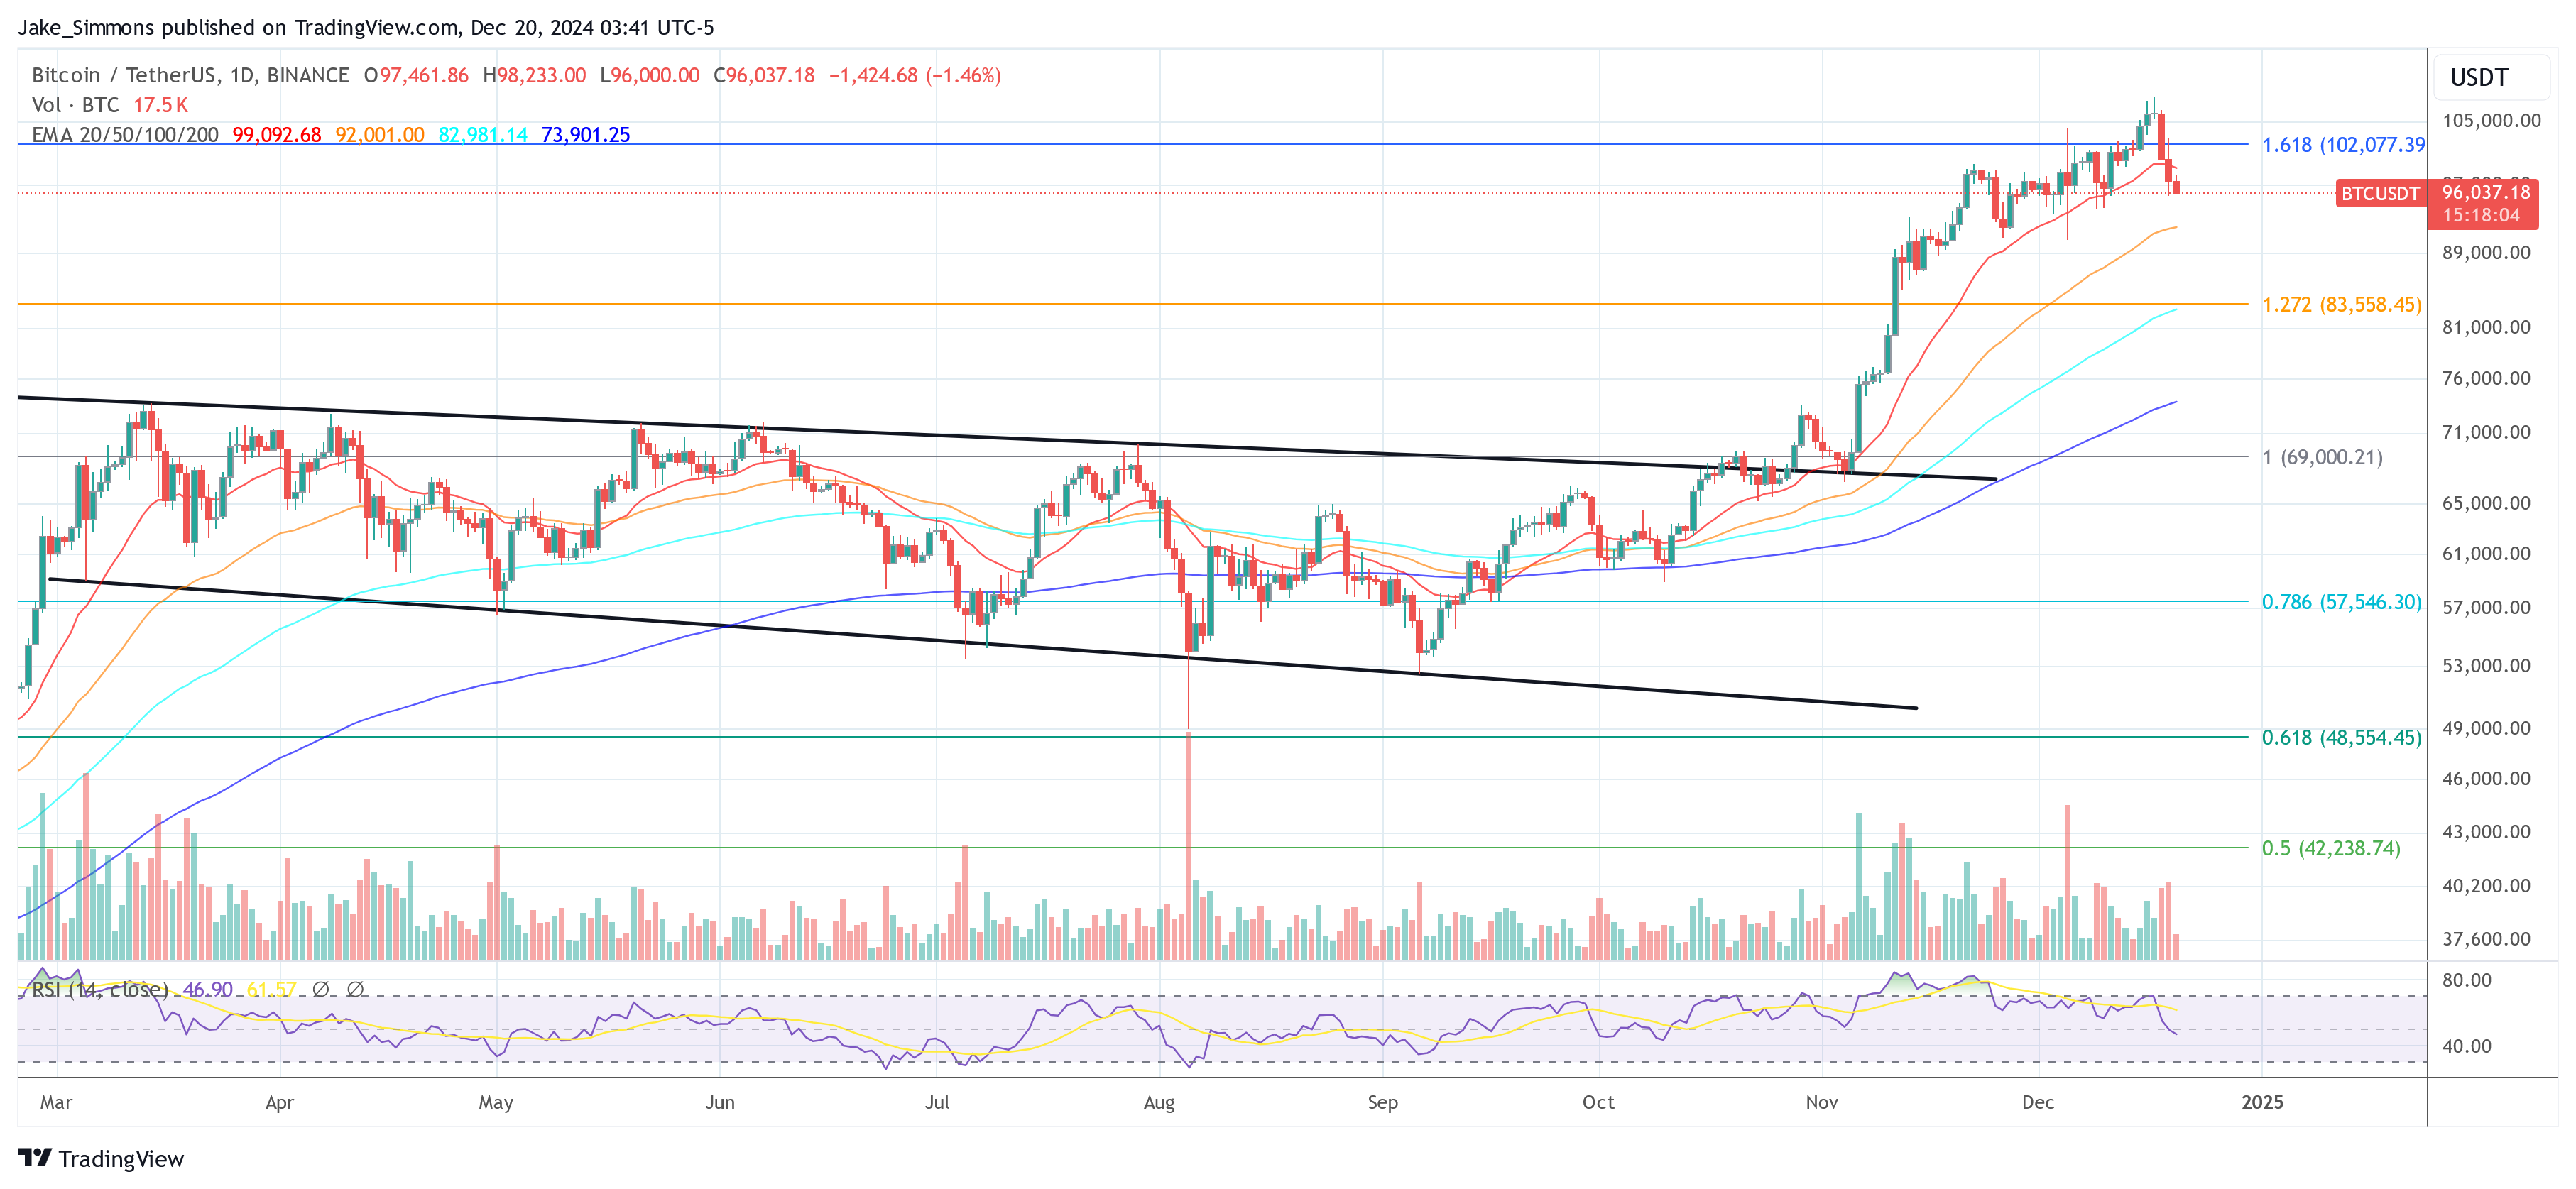
Featured image created with DALL.E, chart from TradingView.com