Close Menu
  • News
    • Bitcoin
    • Altcoins
    • DeFi
    • Market Cap
  • Blockchain
  • Web 3
    • NFT
    • Metaverse
  • Regulation
  • Analysis
  • Learn
  • Blog
What's Hot

The movement centers on stablecoin payments as the layer 2 boom loses momentum

2026-06-04

XRP price to see violent, discontinuous price revisions and $10 could be just the beginning

2026-06-04

XRP Price Takes Another Hit as Bitcoin-Led Weakness Spreads Across Crypto

2026-06-04
Facebook X (Twitter) Instagram
  • Contact
  • Terms & Conditions
  • Privacy Policy
  • DMCA
  • Advertise
Facebook X (Twitter) Instagram
Bitcoin Platform – Bitcoin | Altcoins | Blockchain | News Stories Updated Daily
  • News
    • Bitcoin
    • Altcoins
    • DeFi
    • Market Cap
  • Blockchain

    The movement centers on stablecoin payments as the layer 2 boom loses momentum

    2026-06-04

    Cardano partners with Token Terminal to improve access to on-chain data

    2026-06-03

    France intercepts sanctioned tanker Tagor linked to Russian oil trade

    2026-06-03

    XRP to be included in Bitwise’s first-ever $259 million tokenized fund, CEO speaks out

    2026-06-03

    XRP to be included in Bitwise’s first-ever $259 million tokenized fund, CEO speaks out

    2026-06-03
  • Web 3
    • NFT
    • Metaverse
  • Regulation

    Bank of England stablecoin caps may choke the UK’s pound-token market before launch

    2026-06-03

    Europe is actively trying to stop the takeover of the dollar stablecoin

    2026-06-01

    How a disputed $1 billion claim became a powerful weapon against prediction markets

    2026-05-31

    The US says it has captured Iran’s cryptocurrency with a $1 billion seizure

    2026-05-31

    Hyperliquid’s HYPE rally is bigger than a new all-time high

    2026-05-31
  • Analysis

    XRP Price Takes Another Hit as Bitcoin-Led Weakness Spreads Across Crypto

    2026-06-04

    Bitcoin’s Plunge to $65,000 Leaves Traders Paying to Protect Against a Drop to $50,000

    2026-06-04

    Bitcoin price bursts lower, opening the door to more pain

    2026-06-03

    Banks have pushed Congress to destroy stablecoin proceeds with the CLARITY Act

    2026-06-03

    Goldman Sachs specialist outlines the stock sector he’s excited about amid the historic boom in tech stocks

    2026-06-03
  • Learn

    Williams %R Indicator in Crypto: How to Use %R in Crypto Trading

    2026-06-03

    What Is a Semi-Fungible Token? SFT Crypto Explained

    2026-06-02

    Pennant Chart Pattern in Crypto: How Bullish and Bearish Pennants Work

    2026-06-02

    Head and Shoulders Crypto Pattern: How It Works and How to Read It

    2026-06-01

    Crypto Triangle Patterns: How to Spot and Read Them

    2026-06-01
  • Blog
Bitcoin Platform – Bitcoin | Altcoins | Blockchain | News Stories Updated Daily
Home»Bitcoin»Can This Bullish Chart Pattern Push Bitcoin Price Toward $75,000?
Bitcoin

Can This Bullish Chart Pattern Push Bitcoin Price Toward $75,000?

2024-03-30No Comments3 Mins Read
Share
Facebook Twitter LinkedIn Pinterest Email

The Bitcoin price has enjoyed a remarkable rebound in the past week, drawing parallels to the optimism often associated with Holy Week among Christians. This newfound momentum has permeated the entire market, leading to significant gains for other major cryptocurrencies over the past seven days.

The Bitcoin price revival appears to be in its early stages, with a popular crypto expert on the

Bitcoin Price Reaches $75,000?

In a recent one post on the X platform, Ali Martinez came up with an optimistic prediction for the price of Bitcoin. According to the crypto analyst, the current price action of the leading cryptocurrency indicates that BTC may be ready for another price increase.

This bullish prediction is based on the formation of an inverse head and shoulders chart pattern in a 30-minute time frame. Given the short time frame, if this projection comes true, it will likely become a reality in the coming days.

Typically, a head-and-shoulders price pattern indicates a bullish-to-bearish trend reversal and indicates that an uptrend may be coming to an end. The inverse head-and-shoulder chart formation, on the other hand, suggests the possible reversal of a downtrend, with a potential bullish move on the horizon.

Bitcoin price

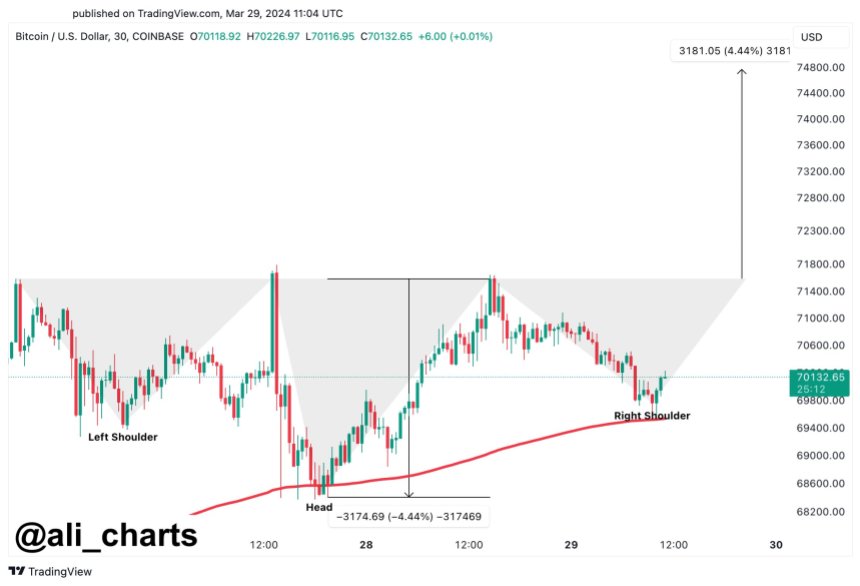
The Bitcoin price forms an inverse head-and-shoulders price pattern on the 30-minute timeframe | Source: Ali_charts/X

According to the highlighted chart above, Bitcoin price is currently trending above the 200 exponential moving average (EMA). If the coin maintains its position above this moving average and manages to cross the neckline resistance at $71,580, Martinez expects the price of BTC to rise further towards $74,760.

See also  Bitcoin Price Crosses $75,000 to Hit New ATH – Will $86,000 Drop Soon?

This target of almost $75,000 would be a new all-time high for the Bitcoin price and a move of almost 5% from the current price point. The current all-time high for BTC is around $73,700, just over two weeks ago.

BTC price overview

At the time of writing, Bitcoin is valued at $69,875, reflecting a 0.7% price decline in the past day. Although the major cryptocurrency is back below the $70,000 level, this slight dip is not substantial enough to erase last week’s gains.

According to data from CoinGecko, the Bitcoin price has risen by almost 10% over the past seven days. After rising to $71,500 earlier this week, BTC is now about 5% behind its all-time high.

Nevertheless, Bitcoin still maintains its position as the largest cryptocurrency in the industry, with a market capitalization of over $1.37 trillion.

Bitcoin price

Bitcoin price hovering around the $70,000 mark on the daily timeframe | Source: BTCUSDT chart on TradingView

Featured image from iStock, chart from TradingView

Disclaimer: The article is for educational purposes only. It does not represent NewsBTC’s views on buying, selling or holding investments and of course investing involves risks. You are advised to conduct your own research before making any investment decisions. Use the information on this website entirely at your own risk.

Source link

Bitcoin Bullish Chart pattern Price Push
Share. Facebook Twitter Pinterest LinkedIn Tumblr Email

Related Posts

XRP price to see violent, discontinuous price revisions and $10 could be just the beginning

2026-06-04

XRP Price Takes Another Hit as Bitcoin-Led Weakness Spreads Across Crypto

2026-06-04

Bitcoin falls to local lows of $61.4K as key data signals a major bearish turn

2026-06-04

Bitcoin: How Liquidations and ETF Outflows Pushed the Price of BTC Below $67,000

2026-06-04
Add A Comment

Comments are closed.

Top Posts

Deribit Moves $783 Million Worth of Ethereum to Cold Storage: A Bullish Signal for ETH?

2024-11-23

NodeMonkes leads NFT sales with US$876K per day, CryptoPunks drops out of the top 10

2024-05-10

Ethereum L2 Networks’ TVL drops to $ 43.29 billion as arbitrum and basic leader

2025-02-04
Editors Picks

An experimental standard for NFTs

2023-05-03

How Tron dominated USDT volumes despite TRX’s sluggish moves

2024-08-14

Multi-Chain Layer 2 focuses on Korea

2024-09-16

What is a layer 1 blockchain? The base layer that powers Bitcoin and Crypto

2025-11-25

Our mission is to develop a community of people who try to make financially sound decisions. The website strives to educate individuals in making wise choices about Cryptocurrencies, Defi, NFT, Metaverse and more.

We're social. Connect with us:

Facebook X (Twitter) Instagram Pinterest YouTube
Top Insights

The movement centers on stablecoin payments as the layer 2 boom loses momentum

XRP price to see violent, discontinuous price revisions and $10 could be just the beginning

XRP Price Takes Another Hit as Bitcoin-Led Weakness Spreads Across Crypto

Get Informed

Subscribe to Updates

Get the latest news and Update from Bitcoin Platform about Crypto, Metaverse, NFT and more.

  • Contact
  • Terms & Conditions
  • Privacy Policy
  • DMCA
  • Advertise
© 2026 Bitcoinplatform.com - All rights reserved.

Type above and press Enter to search. Press Esc to cancel.