

A confirmed Bitcoin [BTC] bottom usually requires coordination between technical data and data in the chain.
From a technical perspective, the market is trying to hold a potential Bitcoin bottom around $60,000, which would help prevent a deeper decline towards the $50,000 area. Over the past three days, BTC consolidated nearly $60,000, adding nearly $1 billion to Bitcoin Open Interest (OI), demonstrating increased speculative positioning and leverage building in the market.
However, looking at Bitcoin’s technical setup, this move feels more risk-driven than strategic positioning. As the chart below shows, since BTC’s rally to $82,000 in mid-May, the market has pushed three lower lows, indicating that each support level has failed to attract strong buy-side demand and has instead caused a series of long price declines.
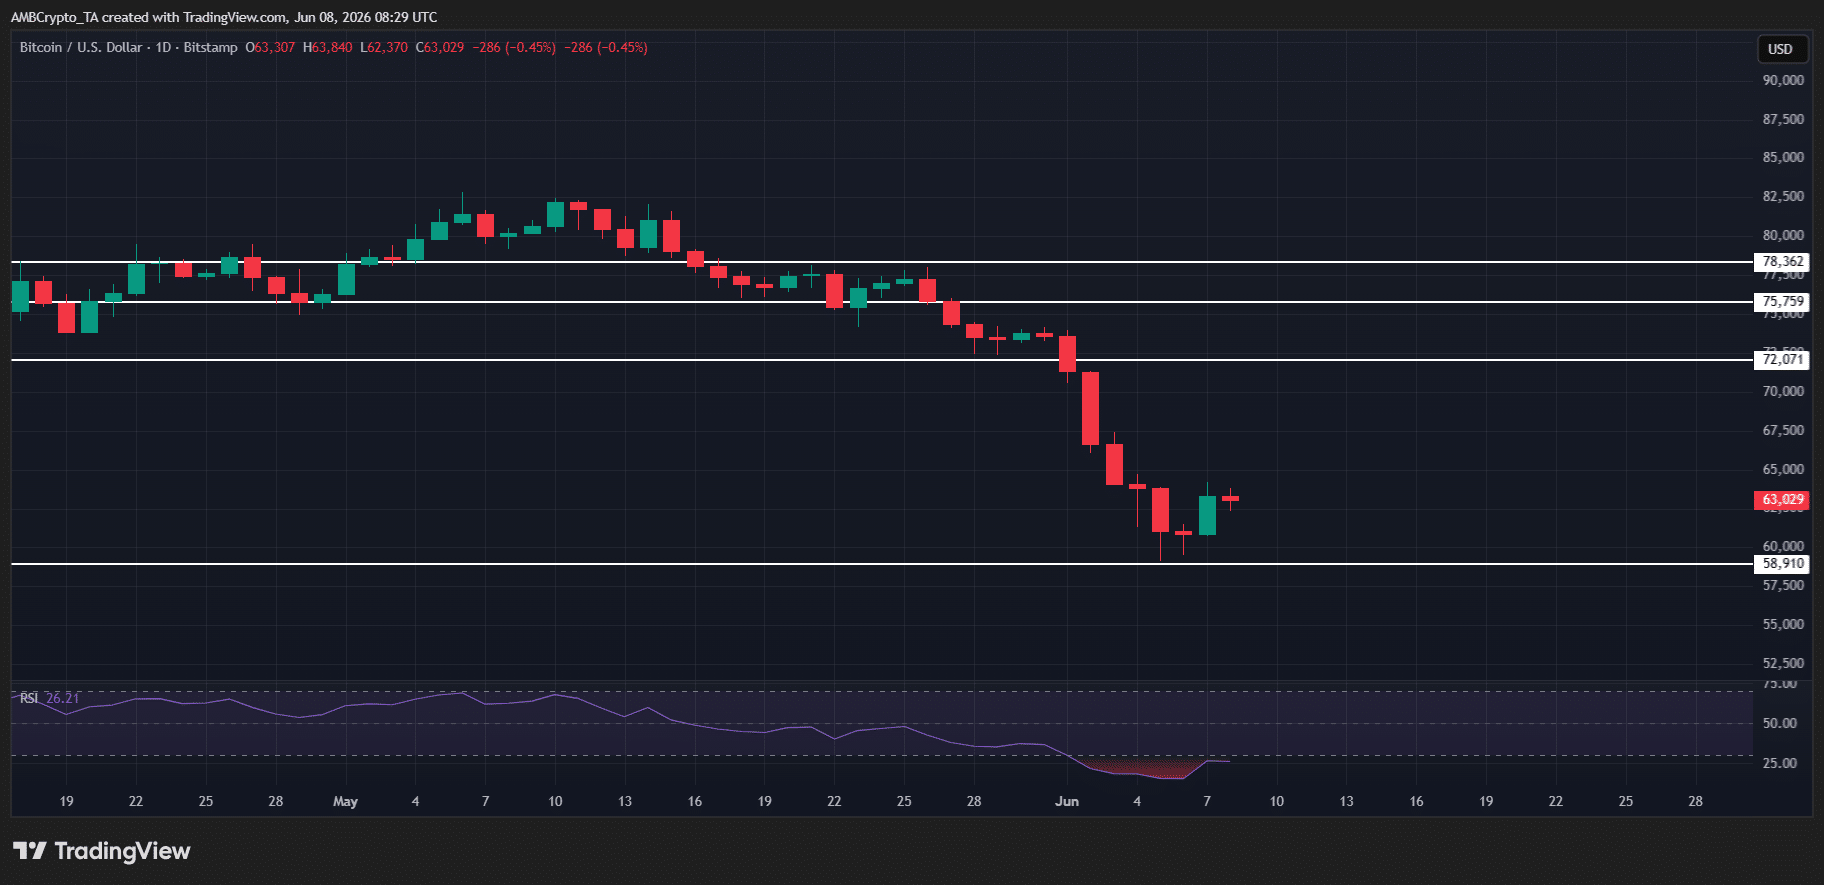
The question now is of course: are we looking at a fourth lower layer formation here?
Notably, in addition to rising OI, Bitcoin funding rates remain positive, highlighting that the market is still leaning towards a bullish bias. That suggests traders remain heavily long positioned, which can work fine as long as momentum continues, but it also puts some pressure on the market if price starts to roll over or if support fails.
This gets even more interesting when you zoom in on Bitcoin’s last 36-hour move. Bitcoin [BTC] rose over 4% on June 7, showing the first signs of bulls entering the dip. However, if the momentum starts to fade from here, the question is whether this will turn into a bull trap instead.
Bitcoin signals remain split as the $60k level is tested
To confirm Bitcoin’s next move, it is crucial to see which side takes control: the bulls or the bears.
At the institutional level, Bitcoin flows have still not recovered, with ETF flows remaining negative. This indicates a lack of dip buying despite BTC’s sideways move around the $60,000 level, reinforcing the sense of risk.
From a technical perspective, this kind of weak current background makes the current range more vulnerable. Price action alone can hold support for a while, but without sustained inflows to support it, rallies tend to fade quickly. This becomes more interesting if you bring in signals from the chain.
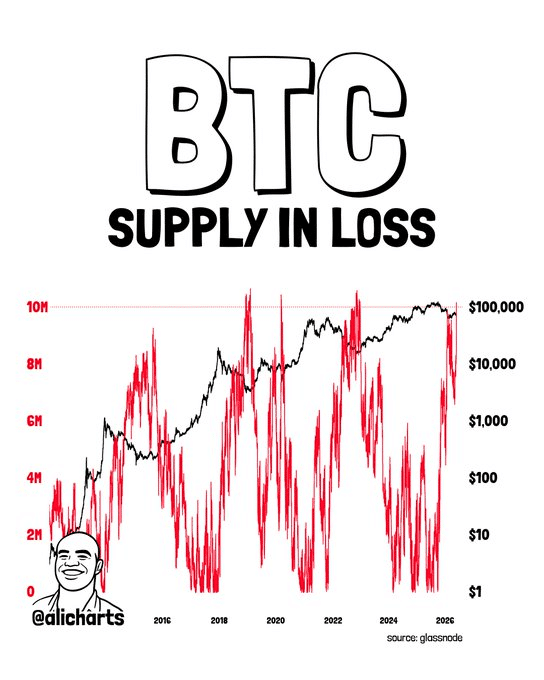
As the chart above shows, Bitcoin has often hit major bottoms when more than 10 million coins are in losses. That level has now been reached, with 10.46 million BTC currently underwater. However, the technical data and signals in the chain still do not match, leaving the market setup a bit inconsistent.
This lack of affirmation becomes more apparent when you consider others analyst notes. Based on Bitcoin’s $174 billion in realized losses, this is not a record, as the last bear market had $211 billion in realized losses. That could indicate that the market still has some room to flush further.
All things considered, this keeps a clean bottom at $60,000 less likely for a while. And when you factor in the rising speculative interest, Bitcoin’s rally is starting to look more like a bull trap, bringing a move back towards $55,000 into view.
Final summary
- Bitcoin is still weak around $60,000, with low inflows and high leverage, increasing the risk of a drop to $55,000.
- Signals aren’t confirming a bottom yet, so the recent rebound could be a bull trap.