

Bitcoin price is gaining a bearish pace below $103,500. BTC could continue to decline if it remains below the USD 103,500 resistance.
- Bitcoin started a new decline below the $105,000 support.
- The price is trading below $104,000 and the 100 hourly Simple Moving Average.
- A bearish trendline is forming with resistance at $103,500 on the hourly chart of the BTC/USD pair (data feed from Kraken).
- The pair could continue to fall if it falls below the $100,000 zone.
Bitcoin price drops again
Bitcoin price failed to stay above the USD 105,500 support level and started a new decline. BTC fell below USD 104,000 and USD 103,500 to enter a bearish zone.
The decline was such that the price even peaked below the $100,000 support. A low was formed at $98,900 and the price is now consolidating losses near the 23.6% Fib retracement level of the downward move from the $111,000 swing high to the $98,900 low.
Bitcoin is now trading below $104,000 and the 100 hourly Simple Moving Average. If the bulls attempt a recovery wave, the price may encounter resistance near the USD 102,000 level. The first major resistance is around the $103,500 level. A bearish trendline is also forming with resistance at $103,500 on the hourly chart of the BTC/USD pair.
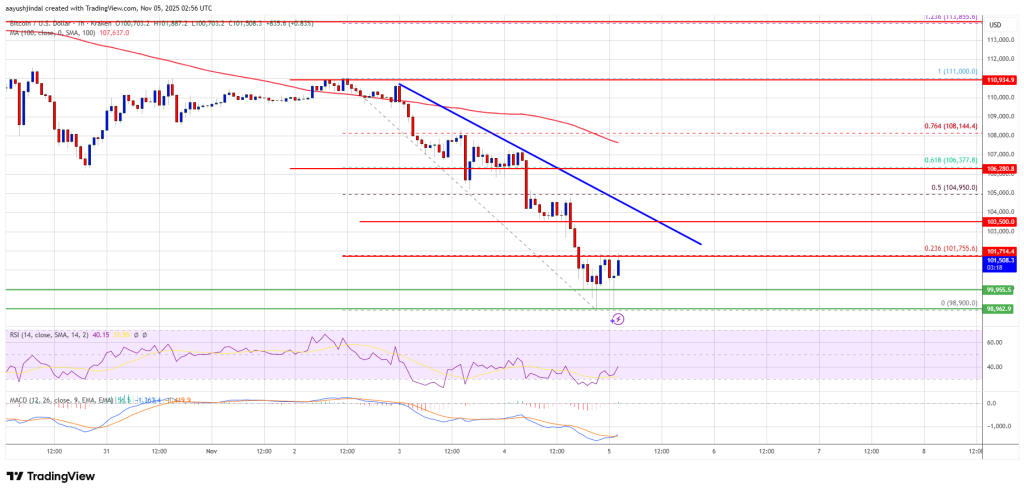
The next resistance could be $105,000 and the 50% Fib retracement level of the downward move from the $111,000 swing high to the $98,900 low. A close above the $105,000 resistance could send the price higher. In the mentioned case, the price could rise and test the USD 106,400 resistance. Any further gains could send the price towards the USD 107,500 level. The next threshold for the bulls could be $108,500 and $108,800.
Lose more in BTC?
If Bitcoin fails to rise above the $103,500 resistance zone, it could continue to decline. Immediate support is approaching the $100,200 level. The first major support is near the $100,000 level.
The next support is now near the $98,800 zone. Any further losses could send the price towards the USD 96,200 support in the near term. The key support is at $95,500, below which BTC could struggle to recover in the near term.
Technical indicators:
Hourly MACD – The MACD is now gaining speed in the bearish zone.
Hourly RSI (Relative Strength Index) – The RSI for BTC/USD is now below the 50 level.
Major support levels – USD 100,200, followed by USD 100,000.
Major resistance levels – $103,500 and $105,000.