Close Menu
  • News
    • Bitcoin
    • Altcoins
    • DeFi
    • Market Cap
  • Blockchain
  • Web 3
    • NFT
    • Metaverse
  • Regulation
  • Analysis
  • Learn
  • Blog
What's Hot

Bitcoin Holds $80K: Why THIS Indicator Signals a Possible BTC Correction

2026-05-14

Animoca-backed NUVA connects Figure’s $19 billion in tokenized assets to Ethereum

2026-05-14

Cardano’s most accurate indicator just turned bullish

2026-05-14
Facebook X (Twitter) Instagram
  • Contact
  • Terms & Conditions
  • Privacy Policy
  • DMCA
  • Advertise
Facebook X (Twitter) Instagram
Bitcoin Platform – Bitcoin | Altcoins | Blockchain | News Stories Updated Daily
  • News
    • Bitcoin
    • Altcoins
    • DeFi
    • Market Cap
  • Blockchain

    Animoca-backed NUVA connects Figure’s $19 billion in tokenized assets to Ethereum

    2026-05-14

    Upbit will launch its own wallet and blockchain chain, signaling the shift to an on-chain platform

    2026-05-14

    OP Concise data confidentiality allows institutions to hide transaction data on Ethereum

    2026-05-14

    Tether unveils developer grant program to fund on-device AI and open-source payment tools

    2026-05-14

    Google BigQuery adds support for ZeroG On-Chain data analytics

    2026-05-14
  • Web 3
    • NFT
    • Metaverse
  • Regulation

    Bitcoin Rips as CLARITY Act Clears Major Senate Committee Hurdle, Advances to Full Senate Floor

    2026-05-14

    Crypto markets are vastly underestimating the passage of the Clarity Act

    2026-05-14

    CLARITY Act faces more than 100 changes as bankers send 8,000 demand letters against stablecoin rewards

    2026-05-13

    Bank lobbyists battle Clarity Act, saying bill would risk ‘flight from bank deposits’ to payment stability

    2026-05-12

    Het Witte Huis onthult dat Amerikaanse banken ‘weigerden’ bijeenkomsten bij te wonen om het probleem met stablecoin-beloningen in de CLARITY Act op te lossen

    2026-05-11
  • Analysis

    A strong XRP position above $1.38 could open the door for another move higher

    2026-05-14

    Ripple Insider Warns XRP Holders as Fake XRPL Airdrop Scams Increase

    2026-05-14

    Wells Fargo Executive Gives Details on ‘Number One’ Stock Picks, Says Company Is Going Through a Generational Restructuring

    2026-05-14

    Ethereum Price Flashes Weakness Signals, Pullback Fears Start to Rise

    2026-05-14

    Ethereum Price Flashes Weakness Signals, Pullback Fears Start to Rise

    2026-05-14
  • Learn

    Invite a Friend, Earn up to 200 USDT: Changelly’s first referral program is live

    2026-05-14

    AI Agent by Changelly: automated crypto swaps and no-code API integration

    2026-05-13

    Parabolic SAR Crypto Guide: Signals, Settings, and Risks

    2026-05-13

    What Is the Average Directional Index (ADX) in Crypto?

    2026-05-12

    Mean Reversion Trading in Crypto: Strategies, Signals, and Risks

    2026-05-12
  • Blog
Bitcoin Platform – Bitcoin | Altcoins | Blockchain | News Stories Updated Daily
Home»Bitcoin»Historical Bitcoin fractal pattern indicates a crash below $20,000
Bitcoin

Historical Bitcoin fractal pattern indicates a crash below $20,000

2023-10-04No Comments3 Mins Read
Share
Facebook Twitter LinkedIn Pinterest Email

A detailed analysis by renowned crypto analyst Rekt Capital has highlighted a recurring bearish fractal in Bitcoin’s historical price data, raising the prospects of a possible crash below the $20,000 mark. This pattern, which was infamous in 2019 and 2022, appears to be reemerging in the current 2023 market.

For those unfamiliar, the fractal indicator identifies potential turning points on a price chart by to emphasize repetitive price patterns. Simply put, a bearish fractal suggests a potential price decline. Such a pattern occurs when there is a peak price with two consecutive lower high bars/candles on the flanks. An up arrow typically marks a bearish fractal, indicating the potential for price decline.

This is why the Bitcoin price could fall below $20,000

The essence of this bearish pattern starts with a double top. Contrary to expectations, this double top is not validated with a dip below a significant support level. Instead, the price typically experiences a relief rally, forming a lower high, only to crash below the aforementioned support.

This support then turns into a new resistance level, causing the price to drop further. This series was observed in both 2019 and 2022, and the current market scenario in 2023 reflects the early stages of this pattern. Rekt Capital suggests the market may be in the middle of this bearish fractal, with uncertainty over where the relief rally could end.

From early April to late August, BTC formed a double top pattern in the weekly chart. However, Bitcoin price remained above the neckline at around $26,000. Then, BTC started its relief rally in mid-August, pushing its price up to $28,600. “We’re probably in A to B [phase of the] bearish fractal,” the analyst added.

See also  BlackRock's Bitcoin ETF Redemptions Drive Coinbase Prime Deposits After BTC Selloff
Bitcoin bearish fractal
Bitcoin bearish fractal | Source: X @rektcapital

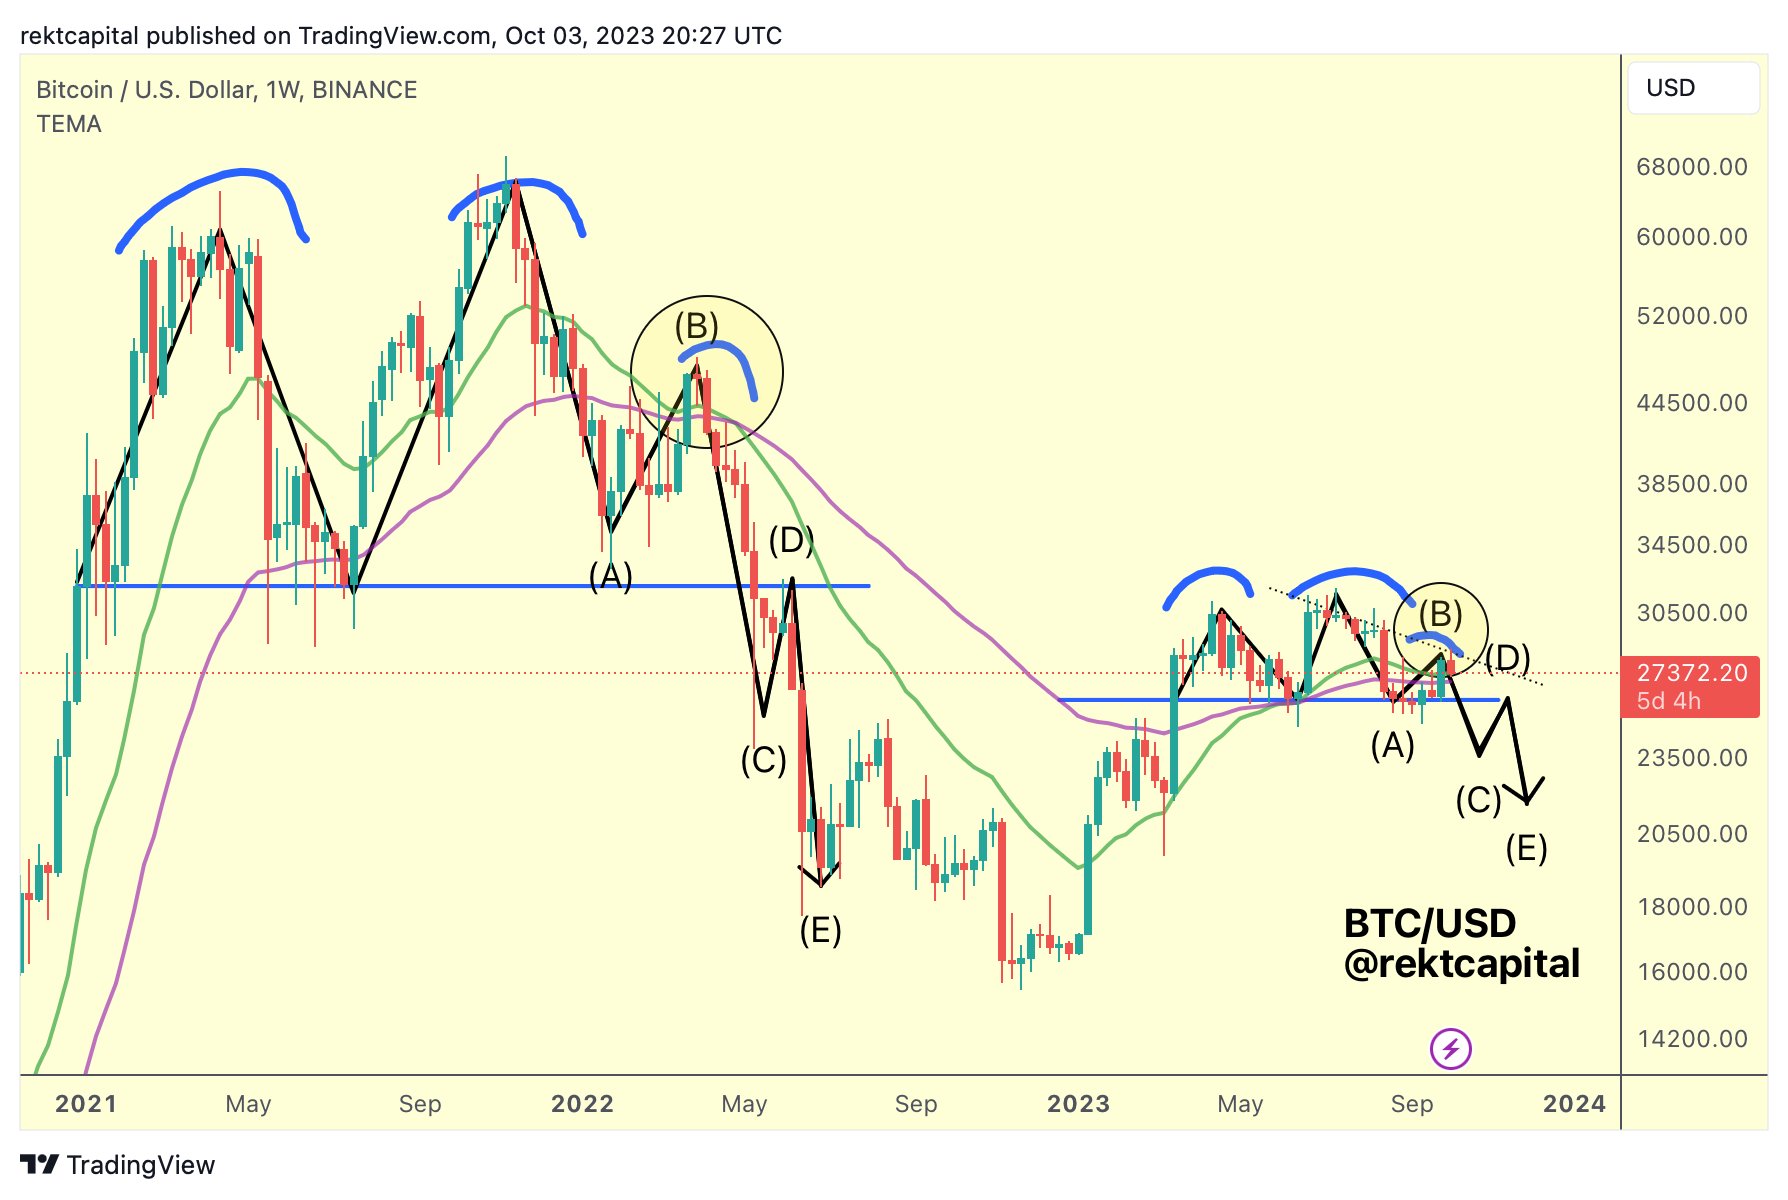
Digging deeper into possible scenarios, the analyst believes Bitcoin’s price could rise to around $29,000 before falling further. Some key events to watch for include potential overextensions beyond the bull market support band. If Bitcoin fails to retest this band and hold it as support after the breakout, the bearish fractal will remain valid.

Another important point to keep an eye on is to revisit the lower high resistance. Even if the price crosses this resistance, a subsequent rejection would keep the bearish outlook intact. However, there are criteria that could debunk this bearish perspective: the bull market support band (blue) consistently holding as support, a weekly close above the lower high resistance ($28,000), and breaking the yearly highs of $31,000.

Lower High is also converging resistance with the 200 week MA
The lower high is associated with resistance during the 200-week MA | Source: X @rektcapital

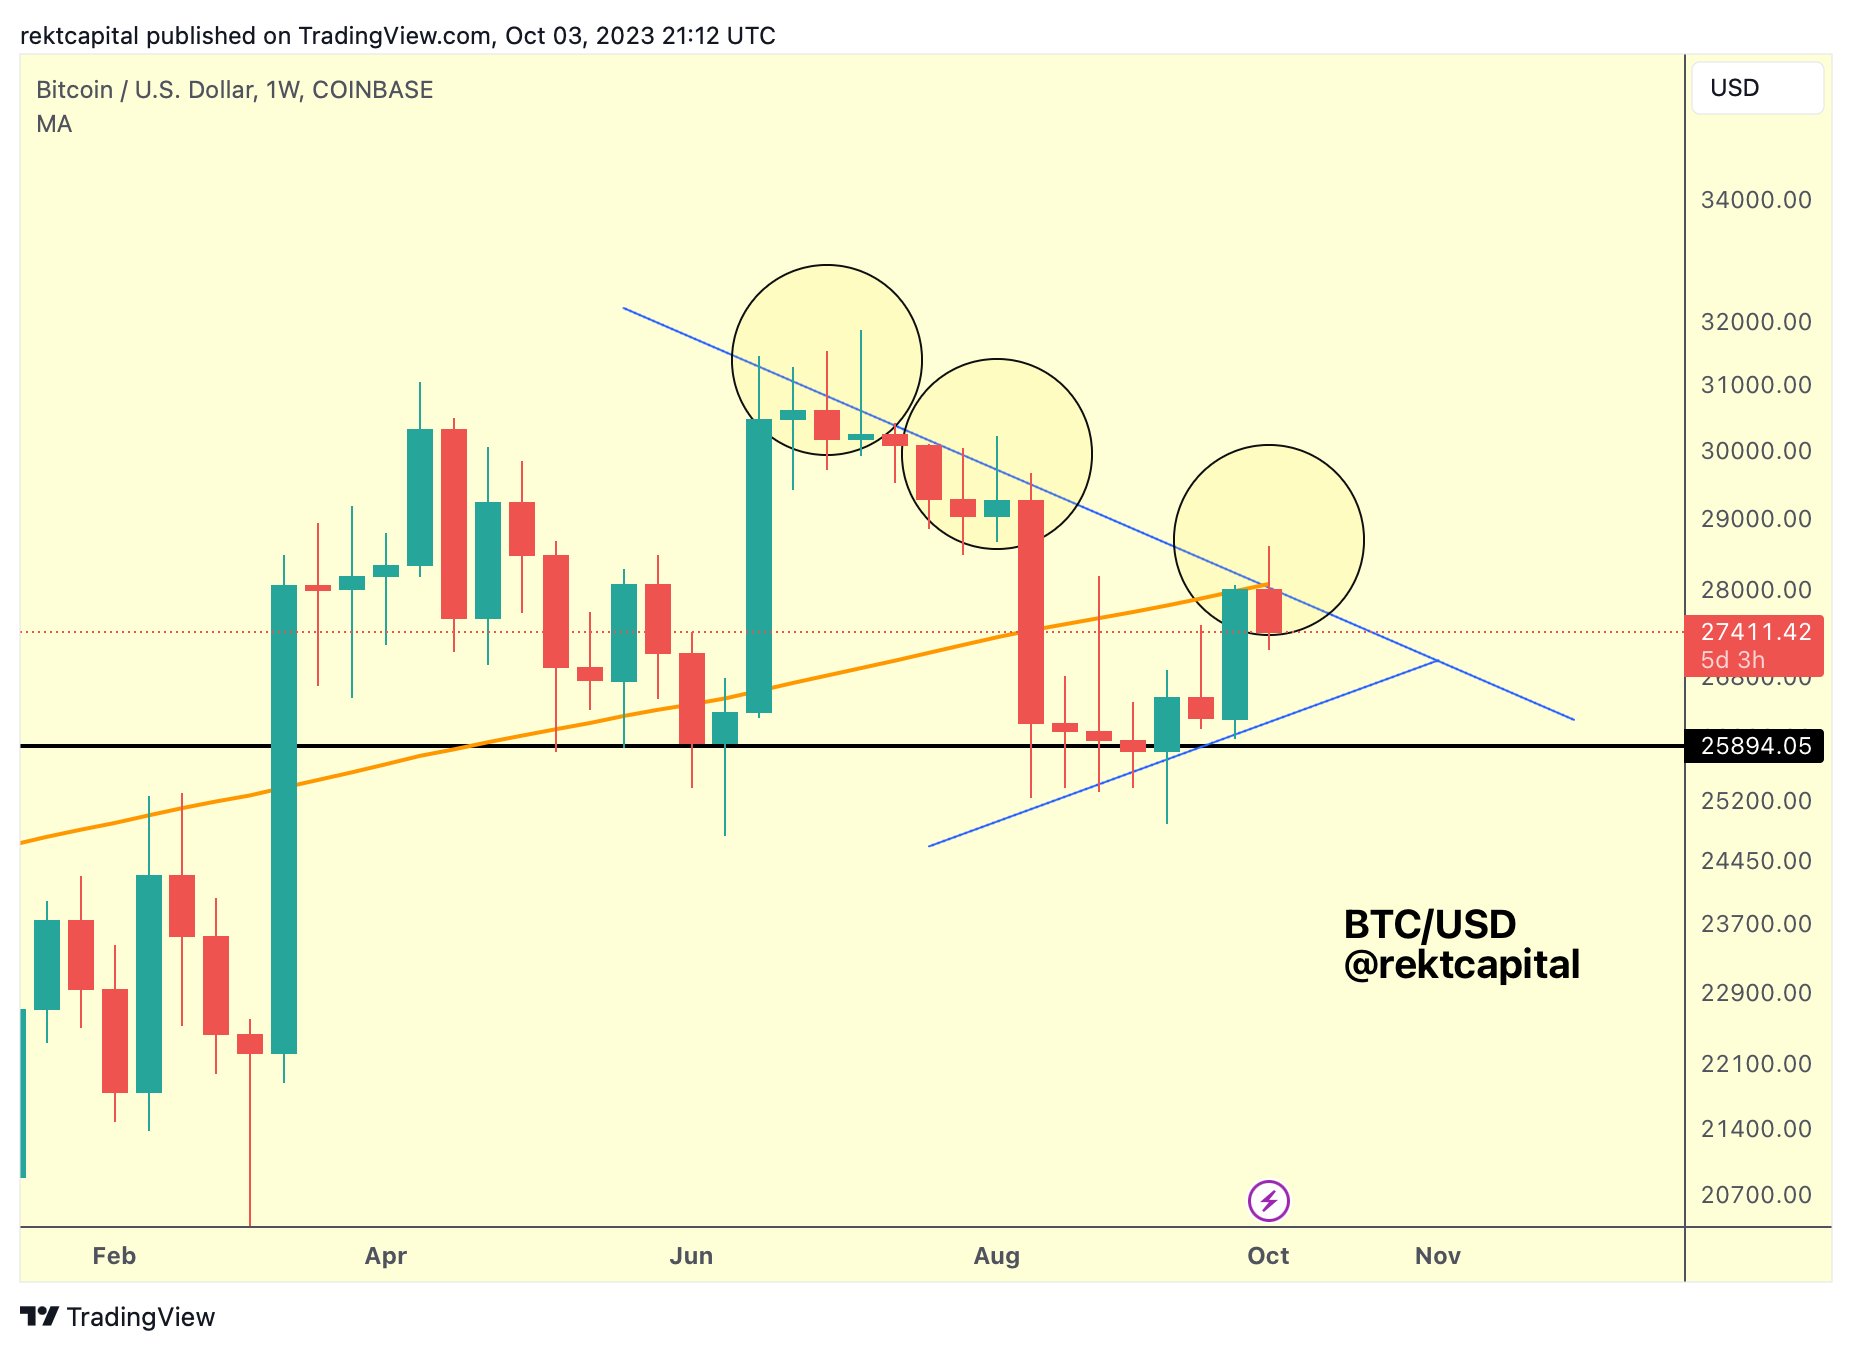
Regarding other technical indicators, Rekt Capital highlighted that Bitcoin recently reached the 200-week MA. However, this moving average (MA) appears to be acting as a current resistance. Moreover, the 200-week MA lines up with the lower high resistance, which marks a crucial moment for Bitcoin’s price in the near future. Despite its macro-bullish stance on Bitcoin, Rekt Capital warns that Bitcoin has yet to overcome the lower resistance at $28,000 on the 1-week chart.

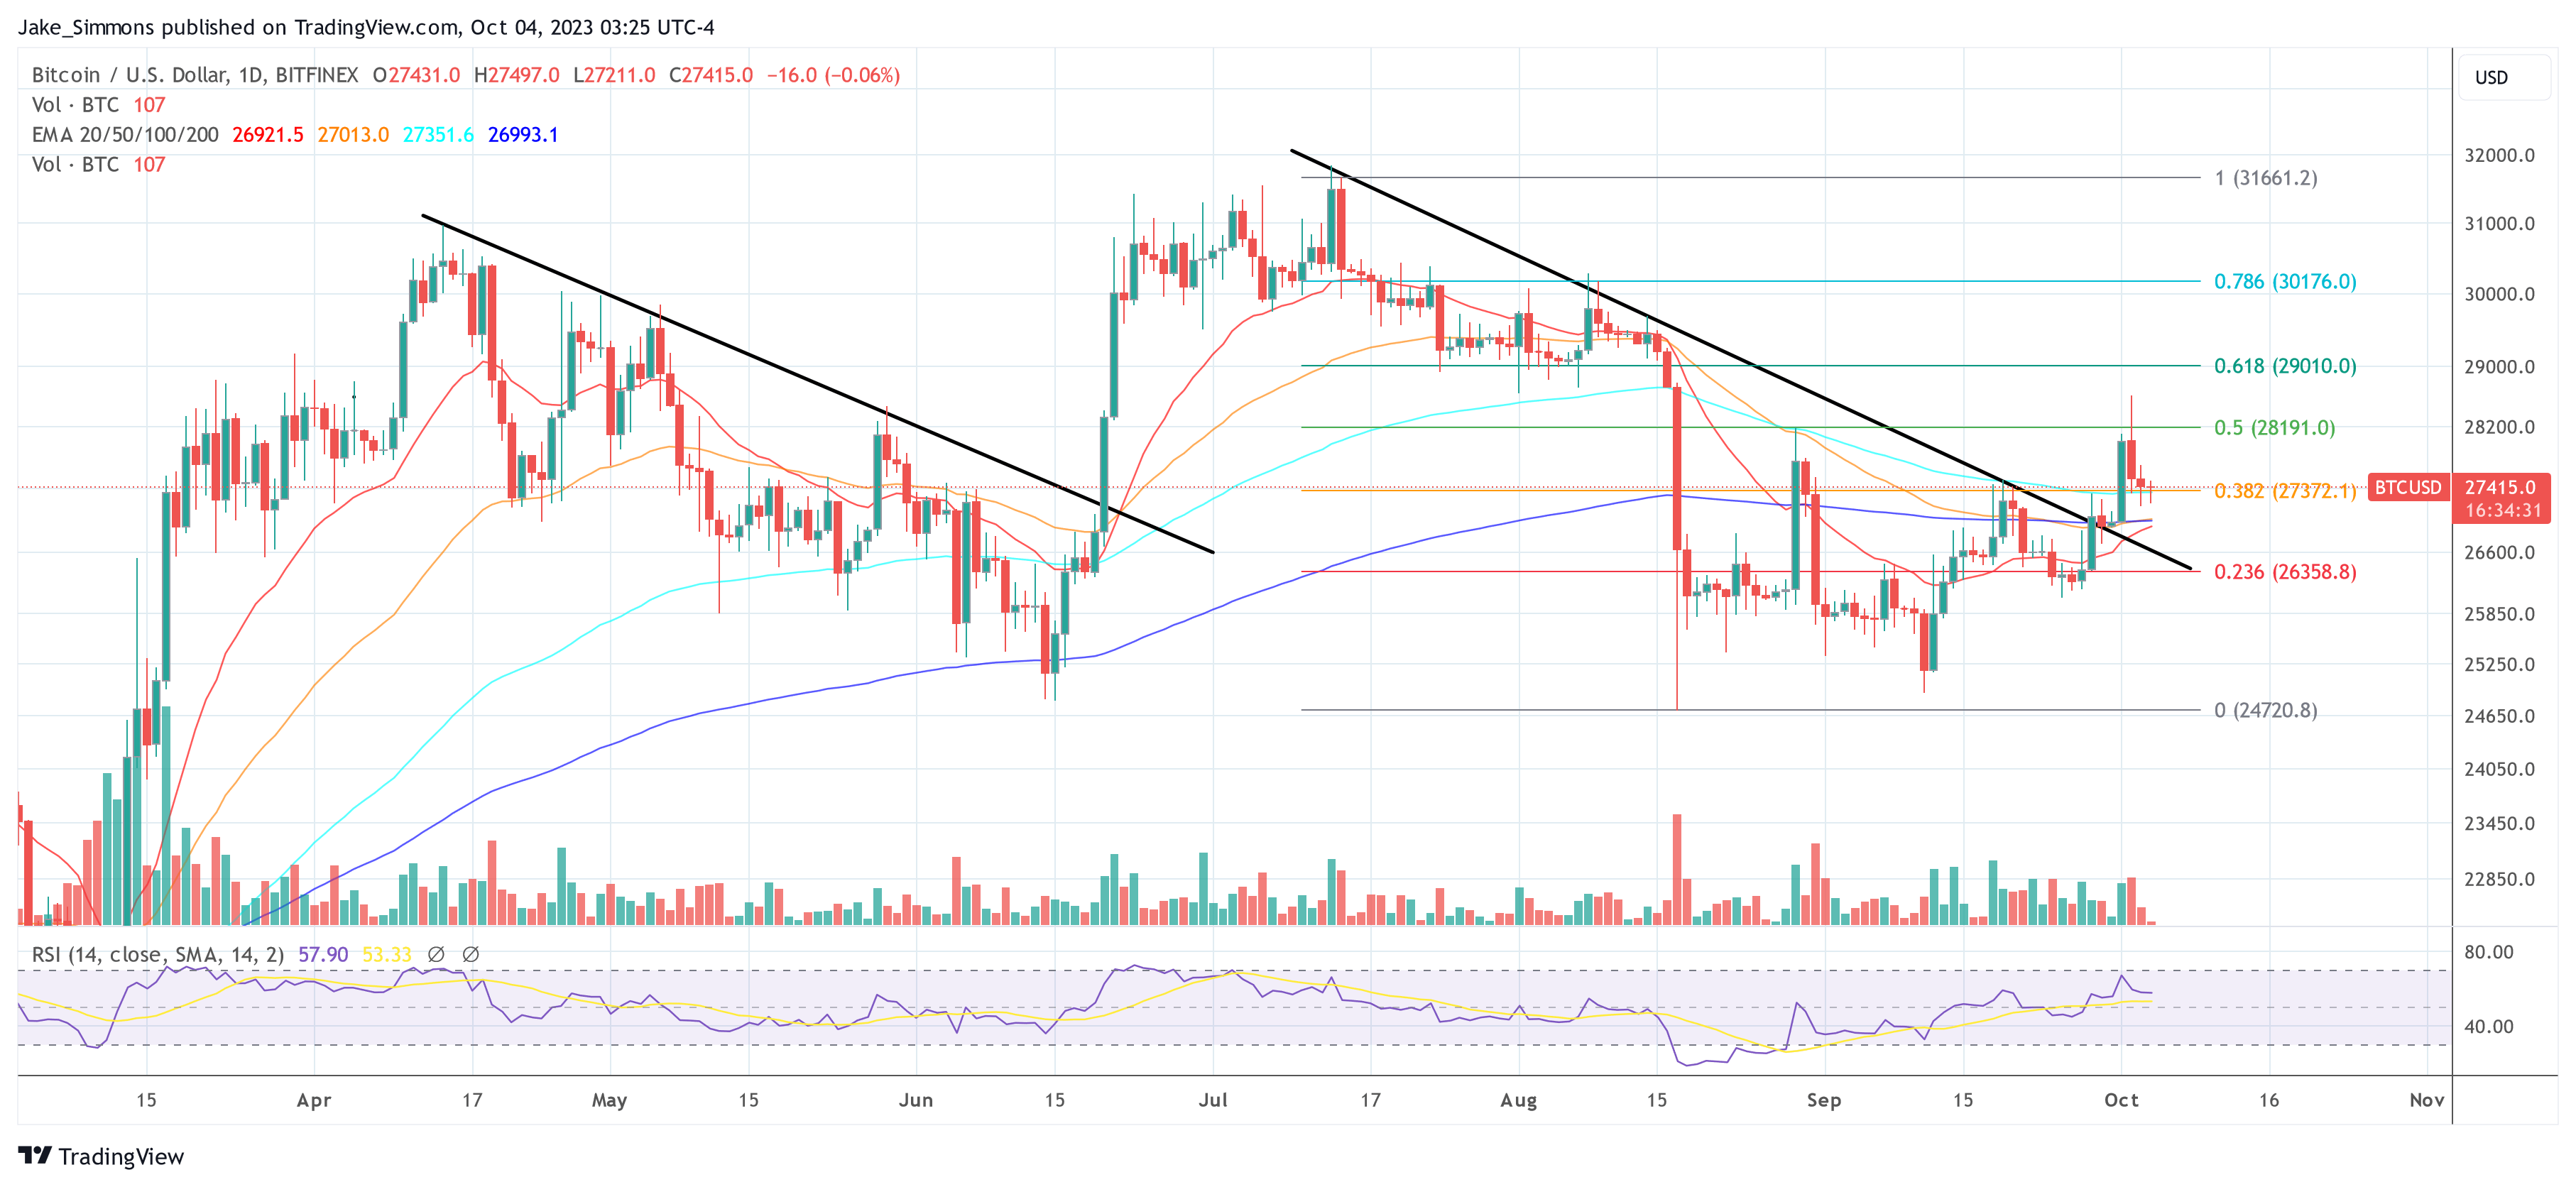
On the daily chart, Bitcoin is hovering slightly above the 38.2% Fibonacci retracement mark. For Bitcoin to avoid a decline below the established trendline (shown in black), it is crucial that Bitcoin maintain a position above $27,372.

Bitcoin price
BTC hovers above key support, 1-day chart | Source: BTCUSD on TradingView.com

Featured image from Shutterstock, chart from TradingView.com


Source link

Bitcoin Crash Fractal Historical pattern
Share. Facebook Twitter Pinterest LinkedIn Tumblr Email

Related Posts

Bitcoin Holds $80K: Why THIS Indicator Signals a Possible BTC Correction

2026-05-14

Jane Street Cuts Exposure to Bitcoin ETFs by 71% – Analyst Sees Bullish Upside

2026-05-14

Why Bitcoin Still Needs Massive Capital Inflows to Spark a Real Bull Run

2026-05-14

Bitcoin Rips as CLARITY Act Clears Major Senate Committee Hurdle, Advances to Full Senate Floor

2026-05-14
Add A Comment

Comments are closed.

Top Posts

“Financialization” of NFTs is moving at lightning speed, report illustrates

2023-05-15

NFT -Sell dive to $ 129.6 million, Pudgy Pinguins jump 63%

2025-08-30

$1.5 Billion Flows Into Tokenized Gold – Are Investors Abandoning Bitcoin?

2025-12-21
Editors Picks

XRP Price Sets Sight on Bigger Gains: Can Bulls Push Higher?

2024-11-12

Nansen and Scroll collaborate for blockchain growth and improved analytics

2024-10-31

SEC Says ‘Stoner Cats’ Are Unregistered Securities in New NFT Enforcement Action

2023-09-13

Authorium appoints Alexis Bonnell by the Board of Directors

2025-07-08

Our mission is to develop a community of people who try to make financially sound decisions. The website strives to educate individuals in making wise choices about Cryptocurrencies, Defi, NFT, Metaverse and more.

We're social. Connect with us:

Facebook X (Twitter) Instagram Pinterest YouTube
Top Insights

Bitcoin Holds $80K: Why THIS Indicator Signals a Possible BTC Correction

Animoca-backed NUVA connects Figure’s $19 billion in tokenized assets to Ethereum

Cardano’s most accurate indicator just turned bullish

Get Informed

Subscribe to Updates

Get the latest news and Update from Bitcoin Platform about Crypto, Metaverse, NFT and more.

  • Contact
  • Terms & Conditions
  • Privacy Policy
  • DMCA
  • Advertise
© 2026 Bitcoinplatform.com - All rights reserved.

Type above and press Enter to search. Press Esc to cancel.