

Ethereum price started a recovery wave from the $2,025 zone. ETH is now consolidating above USD 2,120 and could struggle to clear the USD 2,200 resistance.
- Ethereum started a recovery wave above the $2,120 zone.
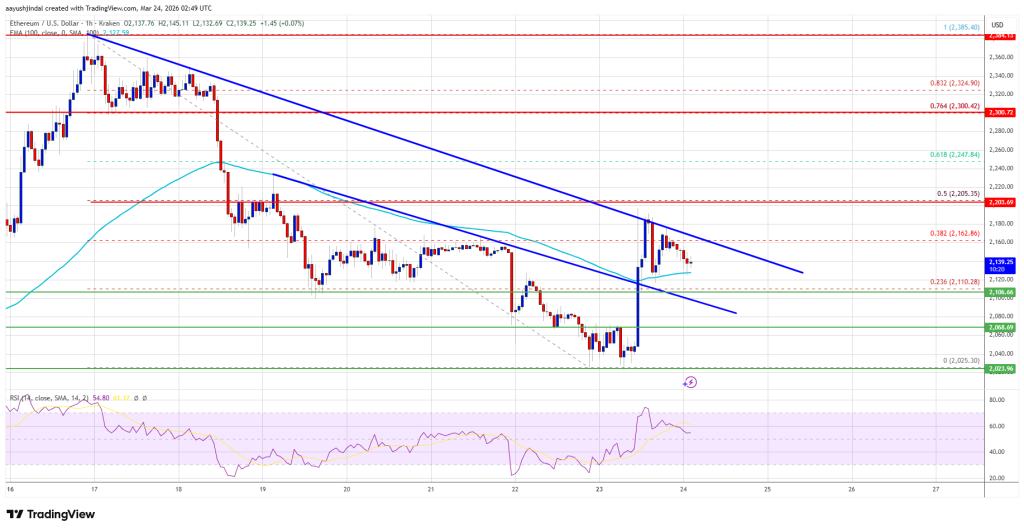
- The price is trading above USD 2,120 and the 100-hourly Simple Moving Average.
- There is still a major bearish trendline active at resistance at $2,165 on the hourly chart of ETH/USD (data feed via Kraken).
- The pair could start a new decline if it stays below the $2,165 resistance.
Ethereum price faces resistance
Ethereum’s price managed to stay above $2,000 and started a recovery wave, just like Bitcoin. ETH price was able to climb above the USD 2,080 and USD 2,120 resistance levels.
The price cleared the 38.2% Fib retracement level of the downward move from the $2,385 swing high to the $2,025 low. More importantly, there was a break above one of the two bearish trendlines with resistance at $2,120 on the hourly chart of ETH/USD.
Ethereum price is now trading above $2,100 and the 100-hourly Simple Moving Average. However, the bears are active around $2,180. Additionally, a major bearish trendline is still active with resistance at $2,165.
If the bulls continue to act above $2,065, the price could rise again. Immediate resistance is seen around the $2,165 level. The first major resistance is near the $2,200 level. The next major resistance is around the $2,250 level. A clear move above the $2,250 resistance could send the price towards the $2,300 resistance or towards the 76.4% Fib retracement level of the downward move from the $2,385 swing high to the $2,025 low.
An upside break above the $2,300 region could lead to more gains in the coming days. In the mentioned case, Ether could rise towards the USD 2,350 or even USD 2,400 resistance zone in the short term.
Another drop in ETH?
If Ethereum fails to clear the USD 2,165 resistance, it could trigger another decline. The initial downside support is near the $2,120 level. The first major support is near the $2,065 zone.
A clear move below the USD 2,065 support could push the price towards the USD 2,025 support. Any further losses could send the price towards $2,000. The main support could be at USD 1,940.
Technical indicators
hourly MACD – The MACD for ETH/USD is losing momentum in the bullish zone.
RSI per hour – The RSI for ETH/USD is now above the 50 zone.
Major support level – $2,065
Major resistance level – $2,165