

Ethereum price failed to reach the $2,200 zone and fell. ETH is now consolidating above USD 2,020 and could struggle to kick off a recovery wave.
- Ethereum started a new decline from the $2,200 zone.
- The price is trading below $2,120 and the 100-hourly Simple Moving Average.
- A major bearish trendline is forming with resistance at $2,135 on the hourly chart of ETH/USD (data feed via Kraken).
- The pair could start a new decline if it stays below the USD 2,120 resistance.
Ethereum price continues to fall
The price of Ethereum did not remain above $2,150 and started a new decline, just like Bitcoin. ETH price fell below USD 2,120 and USD 2,080 to enter a bearish zone.
The bears even pushed the price towards $2,020. A low was formed at $2,032, and the price is now consolidating losses near the 23.6% Fib retracement level of the downward move from the $2,199 swing high to the $2,032 low. There is also a major bearish trendline forming with resistance at $2,135 on the hourly chart of ETH/USD.
Ethereum price is now trading below $2,120 and the 100-hourly Simple Moving Average. If the bulls continue in action above $2,020, the price may attempt to rise again. Immediate resistance is seen around the $2,100 level.
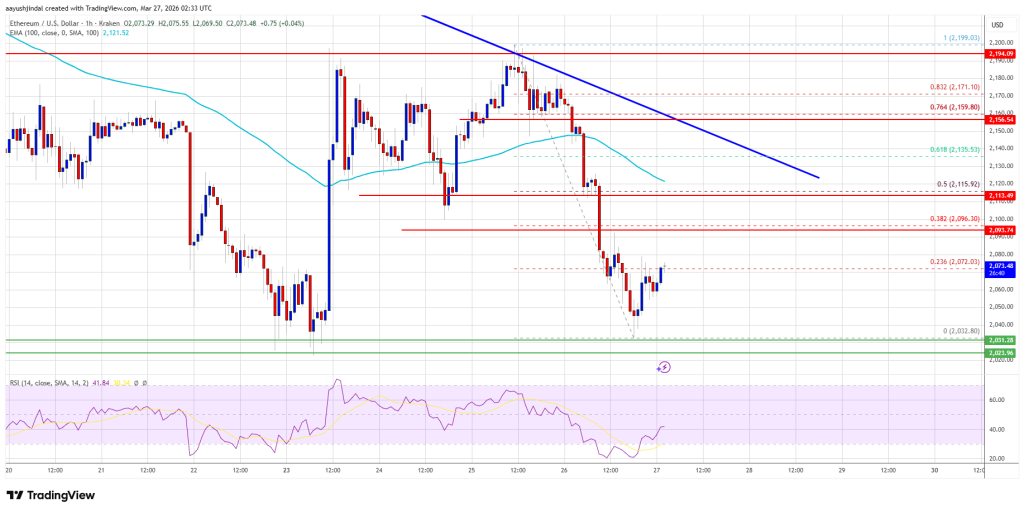
The first major resistance is near the $2,120 level or the 50% Fib retracement level of the downward move from the $2,199 swing high to the $2,032 low. The next major resistance is near the $2,135 level and trendline. A clear move above the USD 2,135 resistance could send the price towards the USD 2,200 resistance. An upside break above the $2,200 region could lead to more gains in the coming days. In the mentioned case, Ether could rise towards the resistance zone of $2,245 or even $2,320 in the short term.
Lose more in ETH?
If Ethereum fails to clear the USD 2,135 resistance, it could trigger another decline. The initial downside support is near the $2,050 level. The first major support is near the $2,020 zone.
A clear move below the USD 2,020 support could push the price towards the USD 1,980 support. Any further losses could send the price towards $1,950. The main support could be at USD 1,880.
Technical indicators
hourly MACD – The MACD for ETH/USD is losing momentum in the bearish zone.
RSI per hour – The RSI for ETH/USD is now below the 50 zone.
Major Support Level – $2,020
Major resistance level – $2,135