

Dogecoin is in a technical area that will look very familiar to traders who followed the 2024 rally. The weekly chart shows that Dogecoin is in the middle of a long-term Fibonacci fan structure derived from the 2021 peak, with the current retest approaching the 0.618 Fib fan, after a similar retest of 0.5 Fib fans preceded the big move in October 2024.
This technical setup confirms no outbreak on its own, but it puts Dogecoin at one of the most important weekly decision points in months.
Related reading
Dogecoin returns to a familiar Fib fan structure
The main idea of this technical analysis is that Dogecoin is still trading within a long-term descending resistance structure that started from the 2021 all-time high price of $0.7316. However, the analysis also uses an interesting Fibonacci wave indicator in the form of growing fan lines extending from the memecoin’s peak price.
These lines have functioned as long-term resistance and breakout markers in the DOGE structure after 2021. Price spent much of 2022 and 2023 under these fan lines and only staged a stronger recovery when it regained one of these.
The comparison is the October 2024 retest. At that time, DOGE fell below the Fib fan area of 0.5, held the structure below for a while, and then followed with a rally that took the price to $0.48 in December 2024. The chart now shows a similar retest developing around the Fib fan of 0.618, with the Dogecoin price currently trading around $0.10 to $0.11.
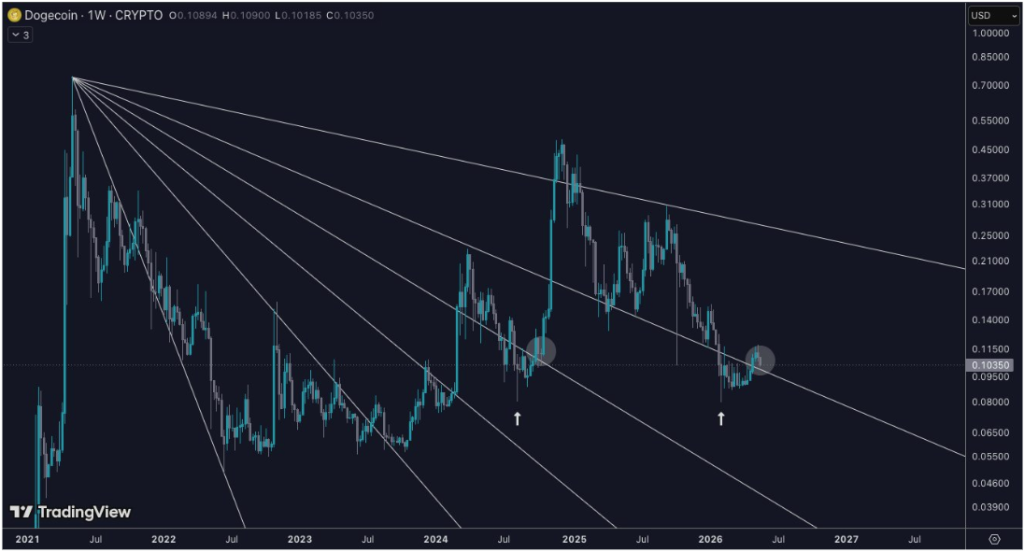
Dogecoin price chart. Source: @_CryptoSurf on X
Is Dogecoin Preparing for a New Wave?
Dogecoin’s current interaction with the indicator shows that it may be checking if another Fib level can behave as support. If so, the arrangement will mean so Dogecoin is building another one base at a Fib fan level similar to the Q4 2024 run.
The ideal scenario for a bullish run is for DOGE to stay above $0.095, break through $0.115, and start climbing back above $0.14. That would make the Fib fan retest of 0.618 look more like the October 2024 setup, where a technical hold came before a bigger wave.
On the other hand, if the setup fails, the repeat pattern loses its credibility and the Dogecoin price can return to a lower level support zones. A weekly breakdown below $0.095 would weaken the current pattern and lead to a consolidation between $0.095 and $0.08.
Related reading
The current price structure of Dogecoin is not yet bullish, but if history is any precedent, the bullish playout is the most possible scenario, as Dogecoin has never spent a notable amount of time below any Fibonacci fan level.
At the time of writing, Dogecoin is trading at $0.1028.
Featured image from Pixabay, chart from TradingView