

To find out if the market has bottomed out, it really comes down to who is in control at the moment: condemnation or capitulation.
Currently, both the technical data and on-chain data are starting to align.
From a technical perspective, Bitcoin is down around 16% this week, which has clearly caused a wave of FUD, with the price now testing the $60,000 support zone and showing strong risk-off momentum across the market.
On-chain, that stress is also starting to become visible. According to data from Santiment, market sentiment was extremely bullish at the late May highs around $78,000, peaking at +456 on May 22. Then it turned sharply as the price collapsed.
Sentiment hit a low of -164 on June 3 and remains negative at the time of writing.
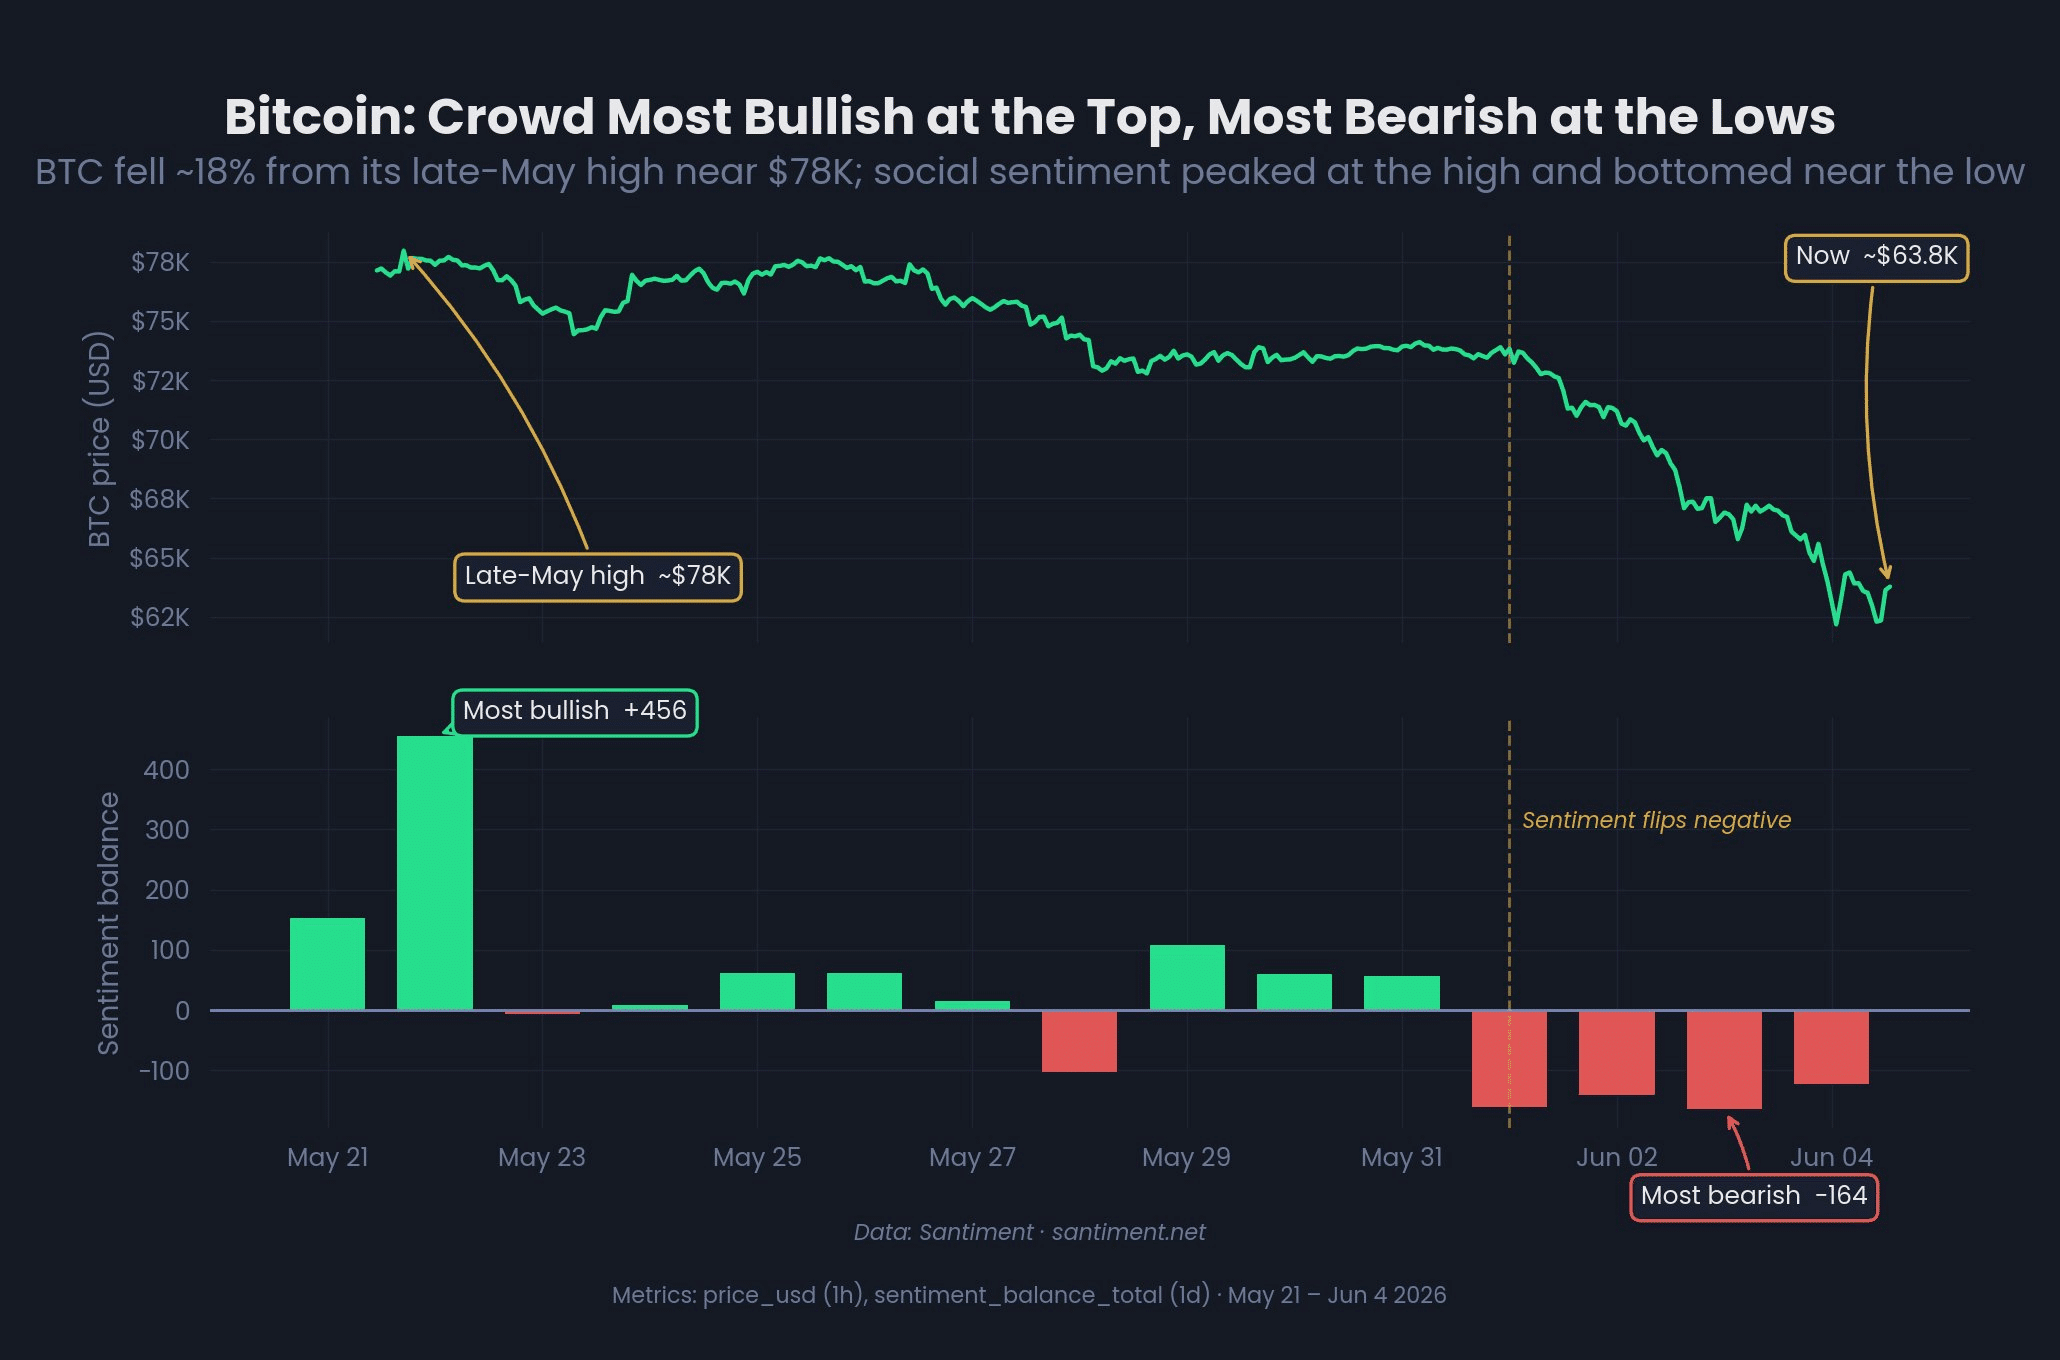
Simply put, the crowd was most bullish at the top and most bearish in the drop.
Historically, however, BTC bottoms have tended to form when buyers capitalize on weakness, positioning buyers early for future returns, especially around periods like the third quarter, which has been relatively strong for Bitcoin in recent cycles.
But such behavior doesn’t really happen right now. Instead, Bitcoin demand has fallen to around 501,000 BTC, marking the deepest contraction of this cycle.
To put this into perspective, spot demand has fallen by approximately -272,000 BTC (30-day sum), while futures demand has also fallen sharply to approximately -229,000 BTC.
All told, both Spot and derivatives point to the same thing: demand is contracting hard right now, and this is one of the most significant declines we’ve seen this cycle.
Against this background, a confirmed Bitcoin [BTC] The bottom still seems premature. With demand still shrinking and selling pressure not yet fully absorbed, the market is still in a phase where capitulation has clearly not yet ended. Instead, it may just be starting.
Half of the Bitcoin supply is lost, but buyers are still absent
Conviction is waning even as the market historically enters a key support area.
On-chain data shows that more than 50% of Bitcoin supply is now experiencing an unrealized loss, with about 10.5 million BTC underwater, while only about 9.8 million BTC is still making a profit.
Historically, this type of crossover has aligned with market bottoms, where weak hands are washed away and long-term accumulation begins.
However, accumulation signals do not appear this time. Instead, investors’ patience is starting to be tested.
According to data from Glassnode, realized losses rose to around $1.3 billion per day, while BTC fell back to $62,000. Strikingly, LTHs accounted for $770 million of this, approximately 59% of the total realized losses.
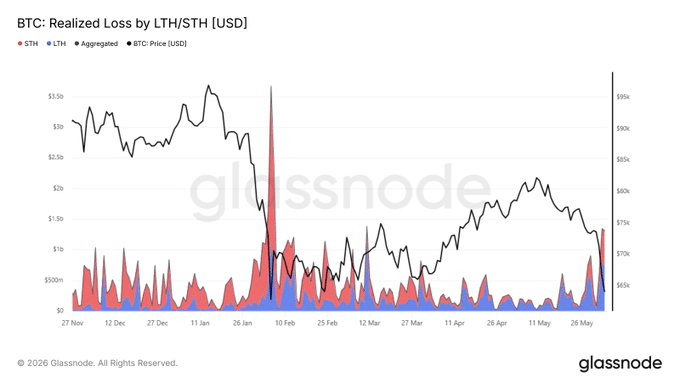
Essentially, the cycle top buyers who held out on the price decline are now starting to exit the market at a loss.
A similar one signal also emerges among short-term holders.
According to data from CryptoQuant, 53.8k Bitcoin fully floated in the last 24 hours from coins held at a loss, while inflows on the profit side fell to zero, marking the most lopsided, loss-driven STH transfer of the year.
All told, Bitcoin’s current setup clearly reflects capitulation, with weak conviction and rising underwater supply suggesting that selling pressure may still be in its early stages. As a result, BTC remains vulnerable here, with downside risk still below $55,000.