

Bitcoin price started a new decline below the $80,500 zone. BTC is consolidating and could struggle to stay above the USD 78,800 support.
- Bitcoin failed to stay above $80,500 and extended losses.
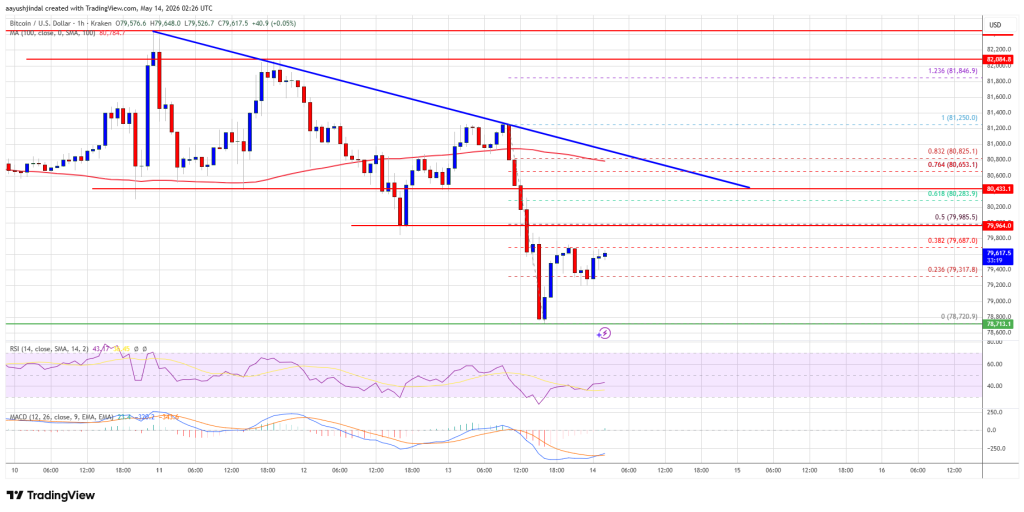
- The price is trading below $80,000 and the 100 hourly moving average.
- A bearish trendline is forming with resistance at $80,700 on the hourly chart of the BTC/USD pair (data feed from Kraken).
- The pair could extend losses if it stays below the USD 80,500 and USD 81,200 levels.
Bitcoin price continues to fall
Bitcoin price failed to stay above the USD 80,500 support zone. BTC remained in a bearish zone and extended losses below the USD 80,000 level. There was a move below the USD 79,500 level.
The price even dropped below $79,000. A low was formed at $78,720 and the price is now consolidating losses. There was a small increase above the 23.6% Fib retracement level on the downward move from the $81,250 swing high to the $78,720 low.
Bitcoin is now trading below $80,500 and the 100 hourly moving average. If the price remains stable above $79,000, another move up can be attempted. Immediate resistance is near the $80,000 level or the 50% Fib retracement level of the downward move from the $81,250 swing high to the $78,720 low.
The first major resistance is around the $80,500 level. A bearish trendline is also forming with resistance at $80,700 on the hourly chart of the BTC/USD pair.
A close above the USD 80,700 resistance could send the price rising further. In the mentioned case, the price could rise and test the USD 81,200 resistance. Any further gains could send the price towards the USD 82,000 level. The next threshold for the bulls could be $82,500.
Disadvantage extension in BTC?
If Bitcoin fails to rise above the USD 80,500 resistance zone, it could trigger another decline. The immediate support is near the $79,200 level.
The first major support is near the $78,800 level. The next support is now near the $78,000 zone. Any further losses could send the price towards the USD 76,200 support in the short term. The key support now lies at $75,500, below which BTC could struggle to recover in the near term.
Technical indicators:
Hourly MACD – The MACD is now losing pace in the bearish zone.
Hourly RSI (Relative Strength Index) – The RSI for BTC/USD is now below the 50 level.
Major support levels – USD 79,200, followed by USD 78,800.
Major resistance levels – $80,000 and $80,700.