

Bitcoin price started a new decline below the $72,500 zone. BTC is consolidating and could continue to fall if it falls below $70,500.
- Bitcoin failed to stay above $73,500 and extended losses.
- The price is trading below $72,500 and the 100 hourly moving average.
- There was a break below a bullish trendline with support at $73,250 on the hourly chart of the BTC/USD pair (data feed from Kraken).
- The pair could extend losses if it remains below the USD 72,500 and USD 73,500 levels.
Bitcoin price takes a hit
Bitcoin price failed to stay above the $74,000 support zone. BTC remained in a bearish zone and extended losses below the USD 73,500 level. There was a move below the $73,000 level.
There was a break below a bullish trendline with support at $73,250 on the hourly chart of the BTC/USD pair. The price even dropped below $72,000. A low was formed at $70,581 and the price is now consolidating losses with a bearish angle below the 23.6% Fib retracement level of the downward move from the $74,161 swing high to the $70,581 low.
Bitcoin is now trading below $72,500 and the 100 hourly moving average. If the price remains stable above $70,000, another increase can be attempted. Immediate resistance is near the $71,950 level. The first major resistance is near the $72,350 level and the 50% Fib retracement level of the downward move from the $74,161 swing high to the $70,581 low.
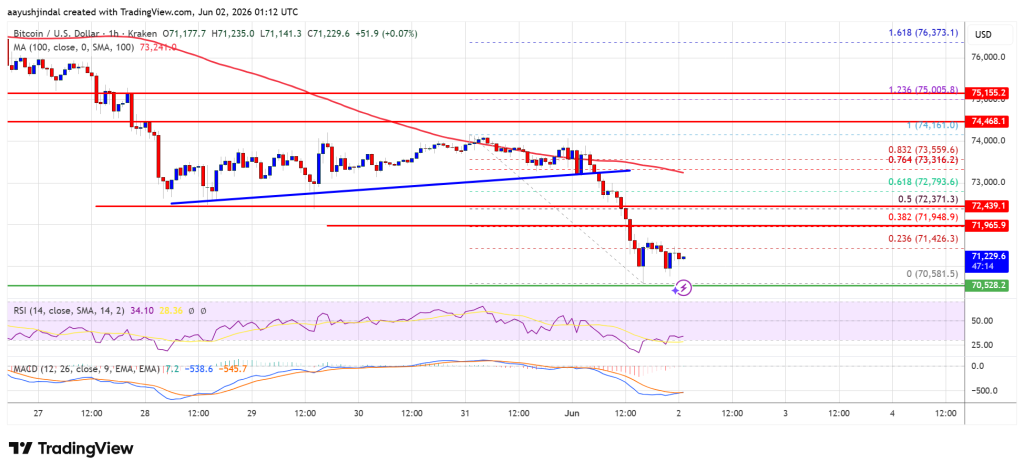
A close above the resistance at $72,350 could send the price higher. In the mentioned case, the price could rise and test the USD 73,500 resistance. Any further gains could send the price towards the $74,000 level. The next barrier for the bulls could be $75,000.
Downward acceleration in BTC?
If Bitcoin fails to rise above the USD 72,500 resistance zone, it could trigger another decline. The immediate support is near the $71,200 level.
The first major support is near the $70,500 level. The next support is now near the $70,000 zone. Any further losses could send the price towards the USD 68,800 support in the short term. The key support now lies at $68,500, below which BTC could struggle to recover in the near term.
Technical indicators:
Hourly MACD – The MACD is now gaining speed in the bearish zone.
Hourly RSI (Relative Strength Index) – The RSI for BTC/USD is now below the 50 level.
Major support levels – USD 70,500, followed by USD 70,000.
Major resistance levels – $71,950 and $72,350.