

Bitcoin [BTC] is up 0.53% in the past 24 hours, but has declined 3% in the past seven days. The cryptocurrency has struggled to regain its initial strength, pushing it above $80,000 in mid-May.
In fact, a number of statistics show that the Bitcoin price is more likely to fall than to reach higher levels. However, this prediction is not certain, but when many indicators rhyme, such moves tend to align.
Liquidation data points to a further decline
For example, last month’s liquidation data from the 30 major exchanges shows a cluster of orders at $57,300. This zone is well below the current level.
Worth noting that there is still a huge liquidation cluster at $70,000, which is a bit far compared to the $57.3K level.
Since the price tends to closely follow liquidity, BTC could drop to $57.3K. However, for this to happen, BTC must lose more strength.
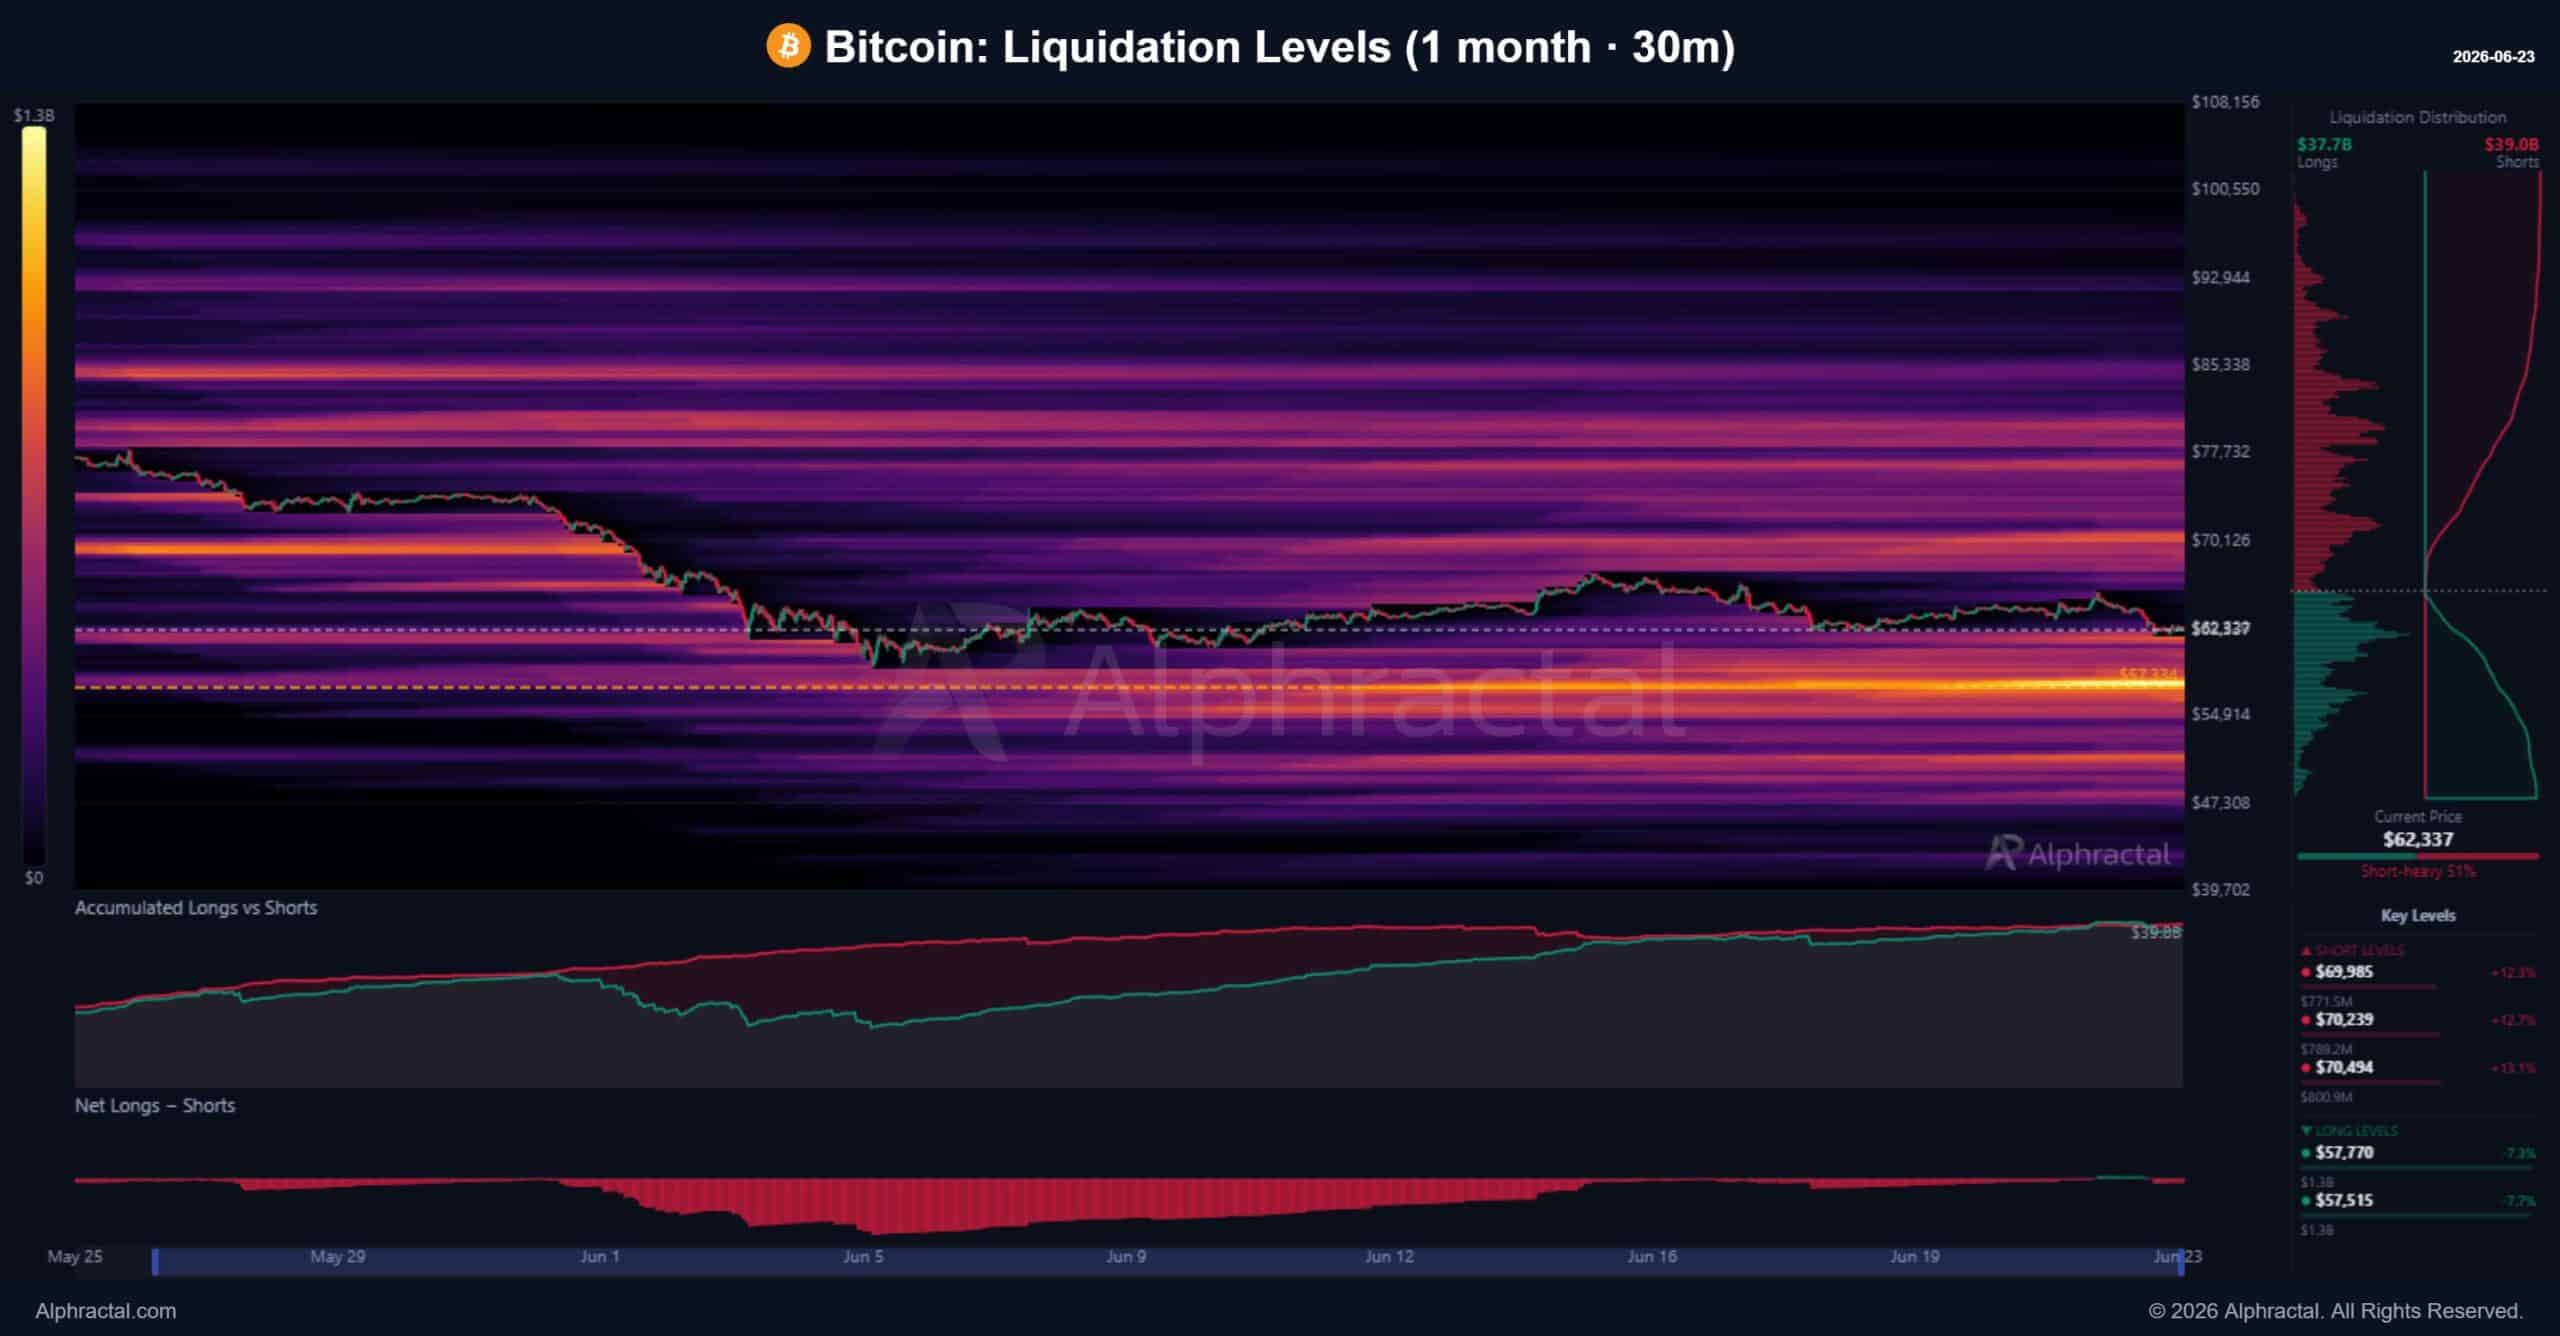
Of the cluster under the current price action, the lowest significant cluster is at $47,300, which is also a possibility.
What is exacerbating BTC’s decline?
Aside from the liquidity magnet resting beneath it, Bitcoin has broken below the Rainbow Chart for the second time in history.
Since its inception, BTC has been trading on the Rainbow Chart channel, but in 2022 it broke through the support and reached $15,500. Now it is up about 4x from this bottom, but back below that at $62,000.
This indicates that the crypto is experiencing weakness, but $62K feels different than $15.5K. In 2022, BTC went low but later broke as bulls bought the dip.
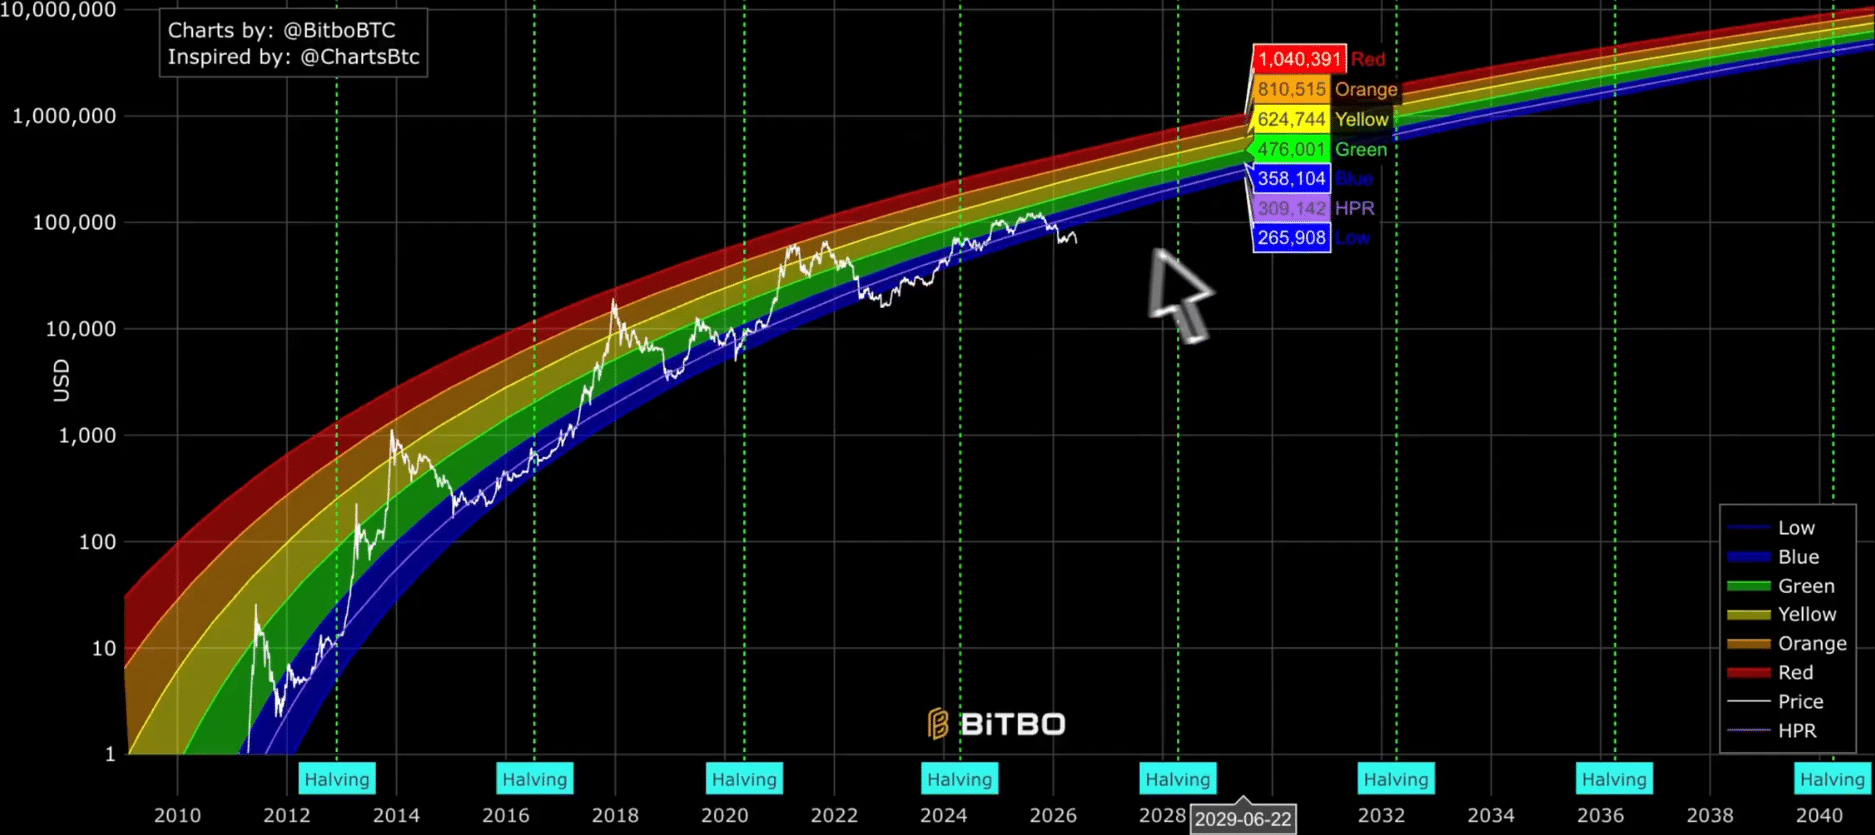
As such, this could indicate that BTC could also fall lower again if history were to align itself. Yet some participants argue that Bitcoin models are no longer suitable for decision-making.
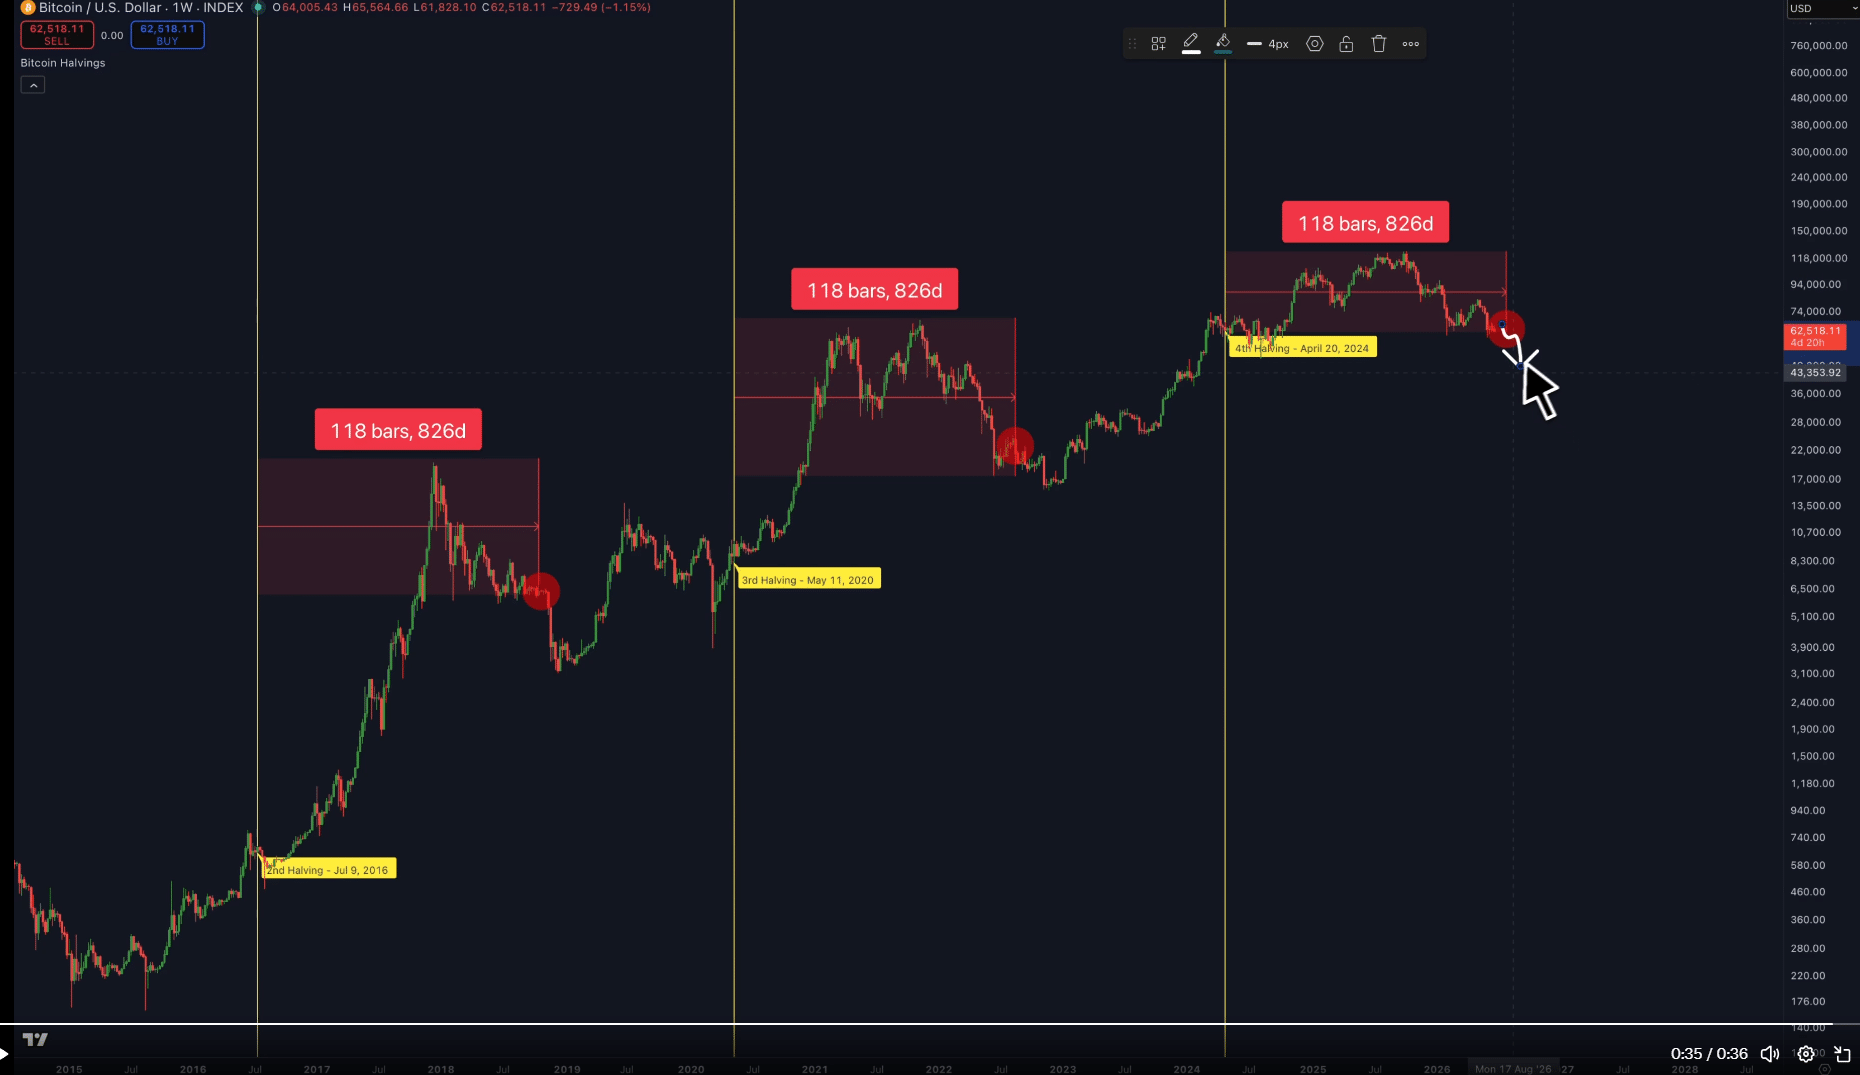
Are there two or more months of weakness to come?
Finally, another interesting phenomenon shows that BTC may continue to decline. Historically, approximately 826 days after each halving marked the final capitulation to the bottom of the bear market. This dates from the end of July.
After that capitulation it took between 70 and 110 days before a major low point was reached. This equates to around October or November, suggesting the decline could continue until then.
Even major institutions like BlackRock are anticipating this decline. Her, for example deposited 2,400 BTC worth about $150 million and 38,337 ETH worth $63 million in Coinbase, possible to sell. Onchain analysts suggest more is on the way.
With that in mind, a further downward trend for BTC is expected at least for the time being. However, markets are generally uncertain and anything can happen between these timelines and change the script.
Final summary
- Bitcoin liquidation heatmaps suggest more price drops are on the horizon, amplified by the breakup of the Rainbow channel.
- Historical data shows that BTC may continue to fall through the end of July, but a major low is expected in October/November as institutions continue to sell.