

According to Lookonchain a Bitcoin [BTC] Whale recently withdrew 2,341 BTC worth $144.68 million from OKX. However, this outflow from a centralized exchange could not have been an isolated incident.
Foreign exchange reserves have shrunk recently, with flow data indicating continued accumulation. And yet, on the other side, demand conditions were also “very unfavorable,” according to a crypto-on-chain analyst.
For example, the 200-week moving average and quantile value of 200WMA showed that Bitcoin may be nearing the bottom of the current bear market despite the accumulation.
A comparison of the price action at the time of writing with that of November 2025 indicated that another sell-off and a flush towards the $53K level could also be possible.
November and the ongoing decline have a number of factors in common
The price action over the past few days has been solidly bearish. The upswing did not attract as much trading volume as the decline. Structurally, it appeared similar to the crashes of early February and late November 2025.
However, November’s price action showed one key similarity to trading in recent days.
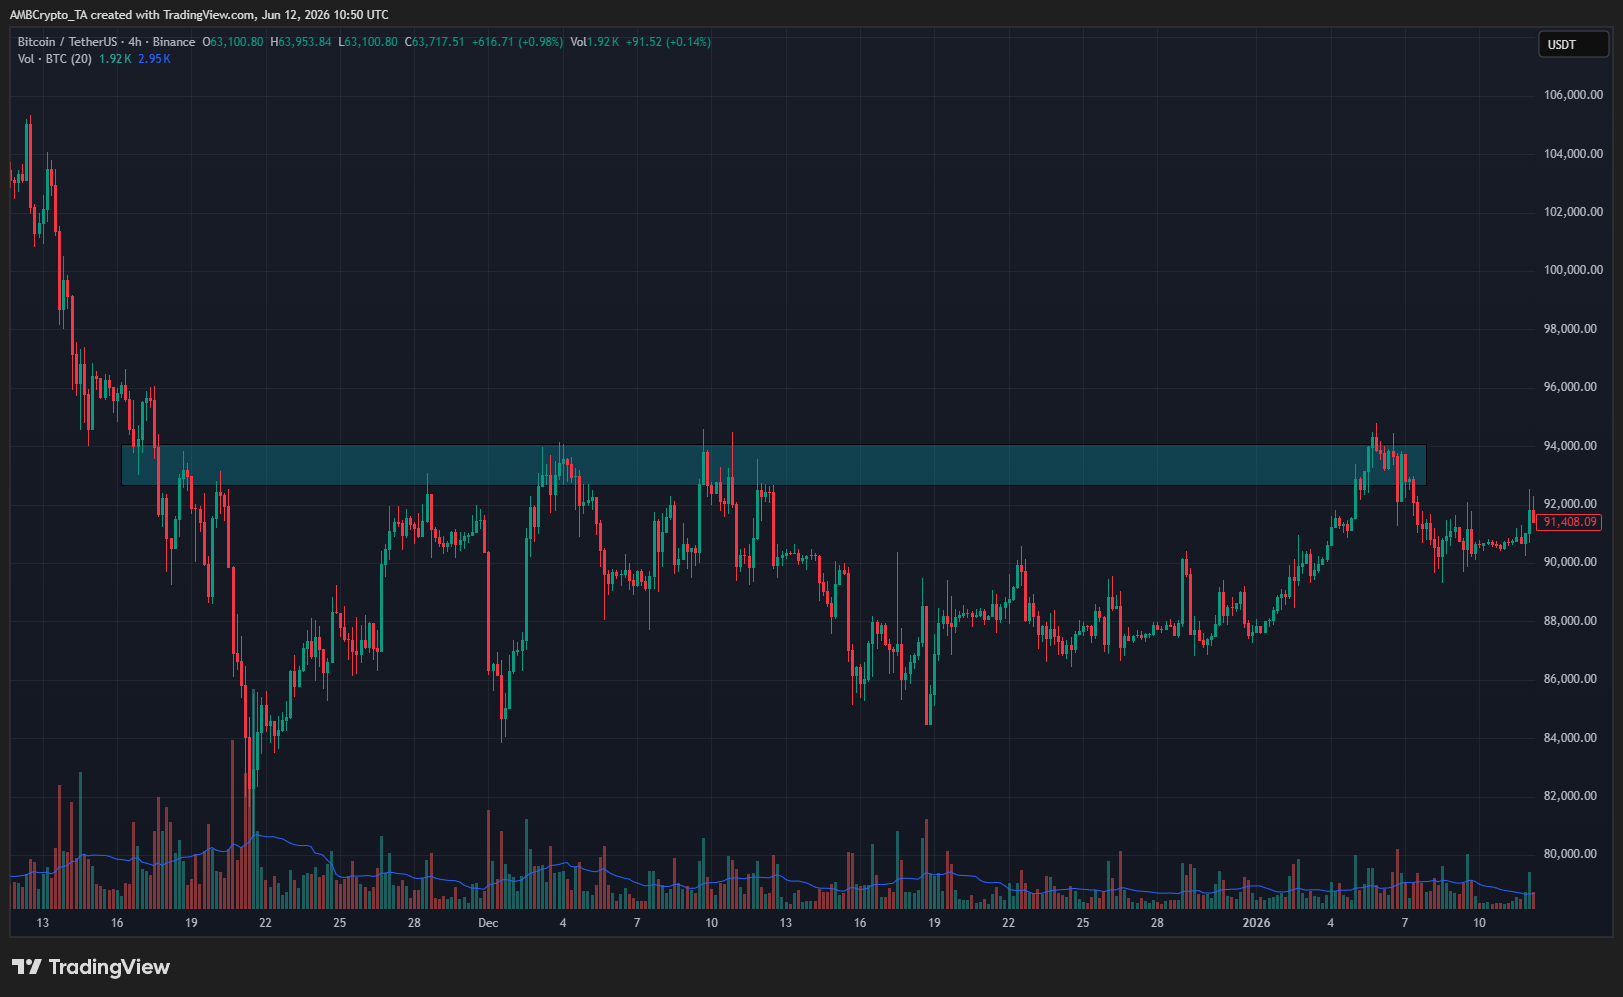
Within a few weeks of hitting the low of $80,600, Bitcoin bounced back to the local supply zone at $93,000. This area also marked the final culmination of the internal structure.
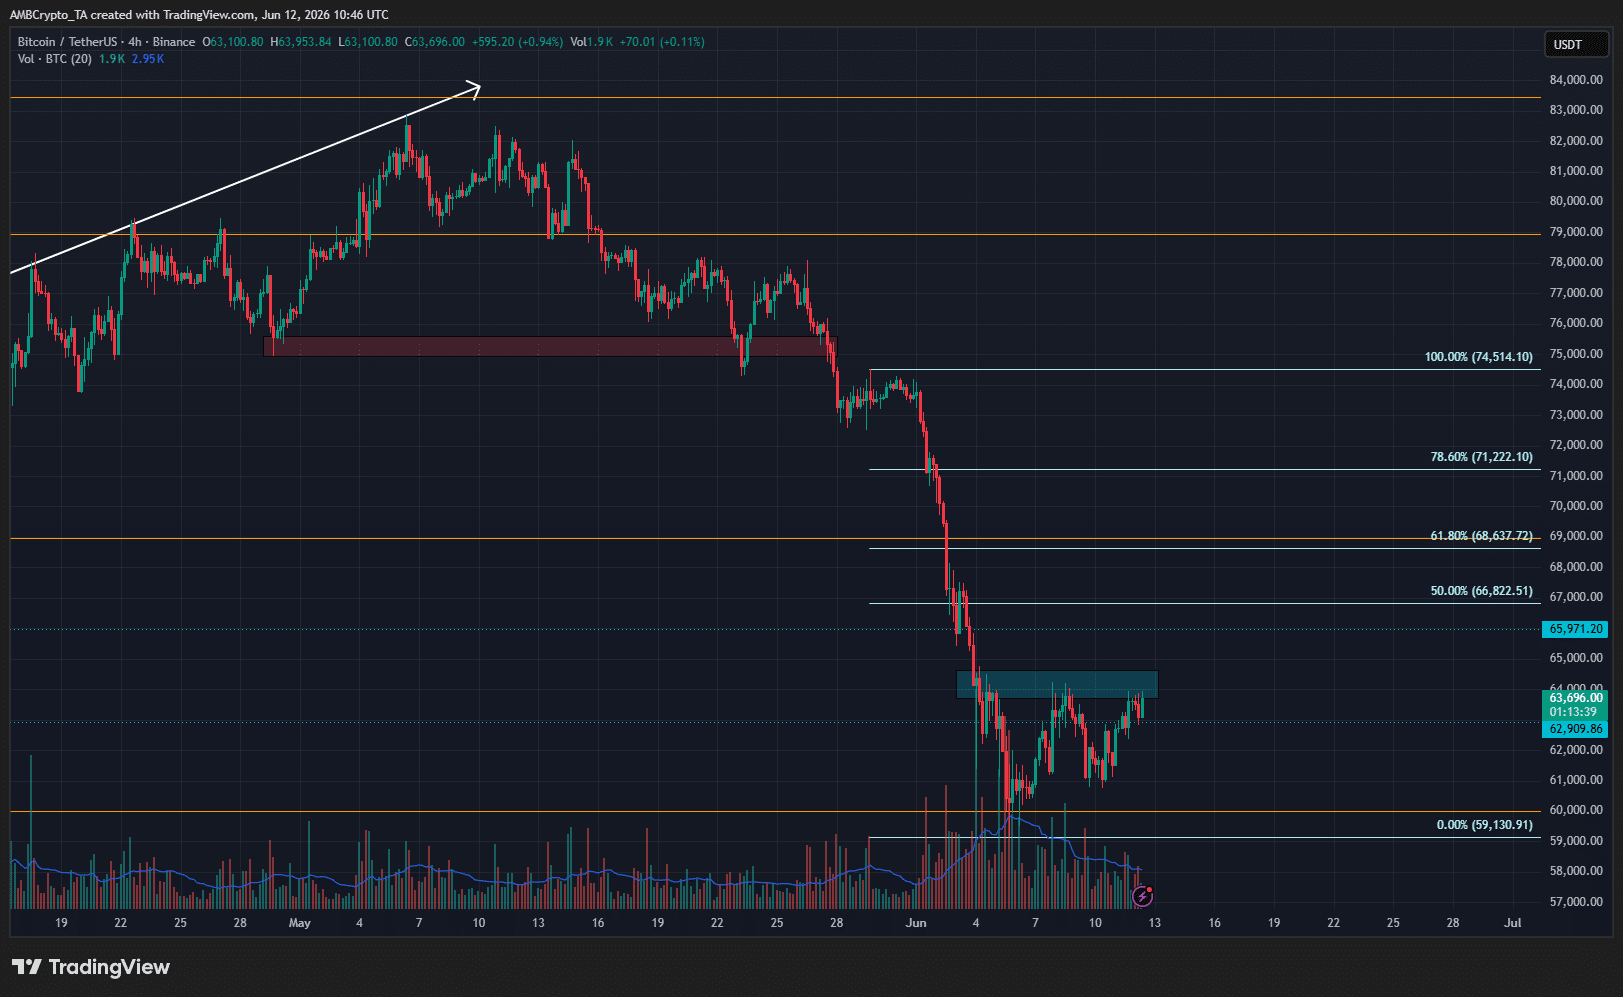
The situation could be the same for Bitcoin in June 2026. At the time of writing, the local high of the internal structure was at $64.5K – an area that the leading cryptocurrency has not broken in almost a week after the bearish impulse move.
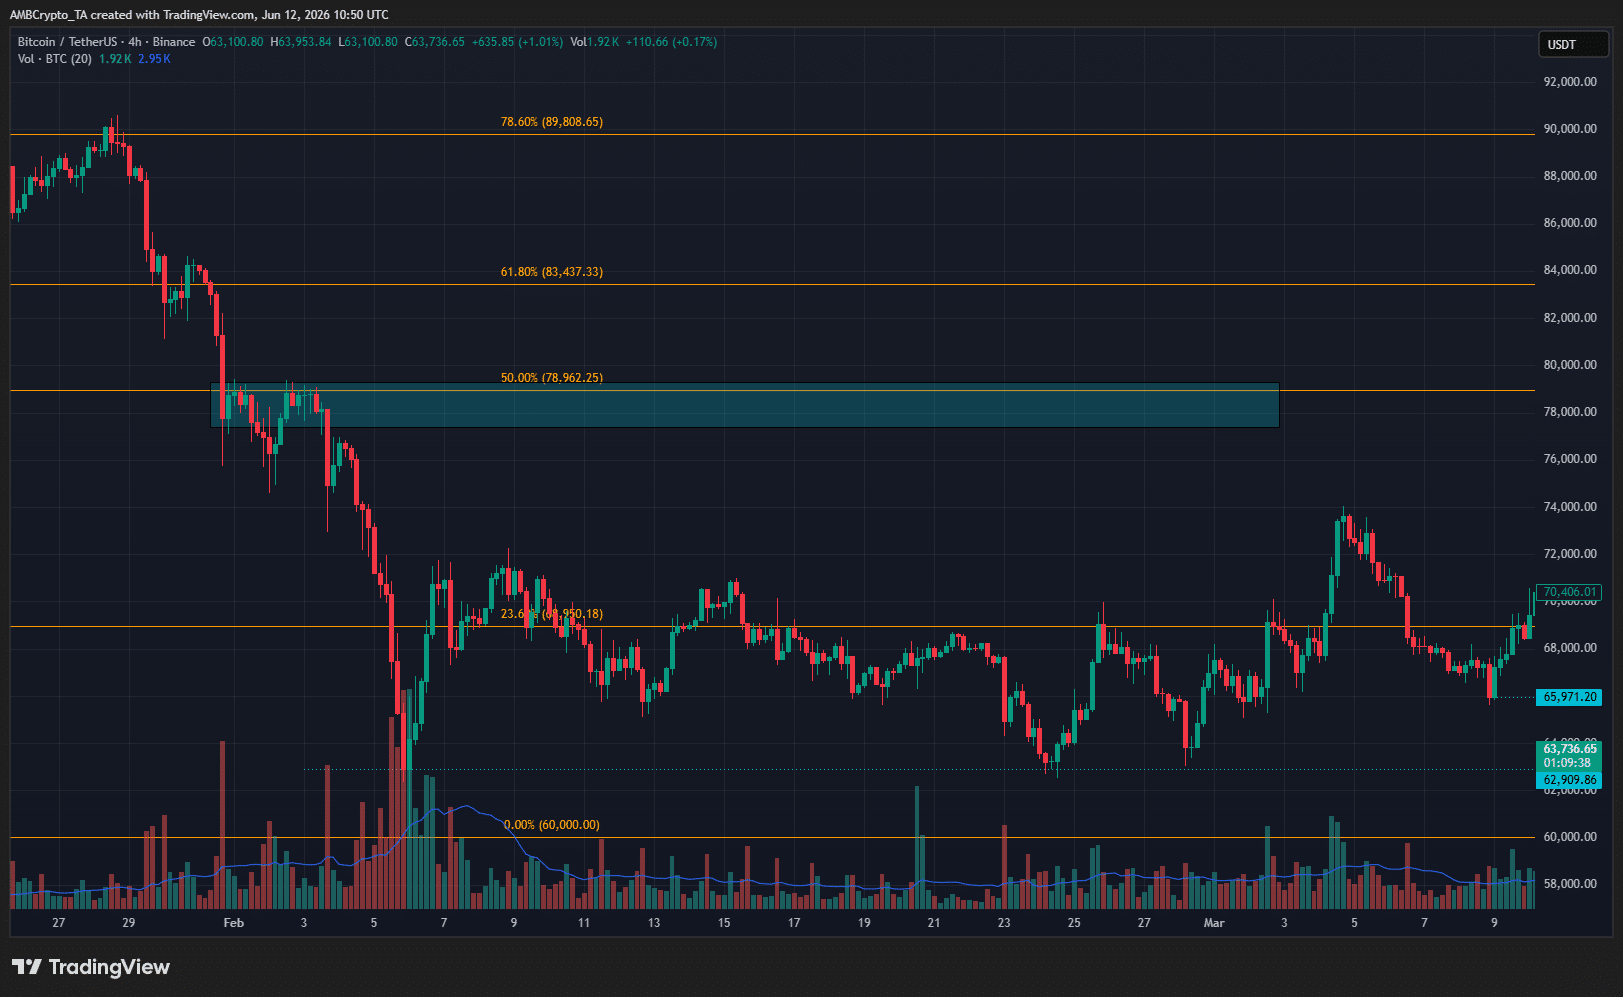
By comparison, the February crash was much more volatile and panicky, and it took two months for a relief rally to break this level.
What does this mean for traders and investors?
In November-December 2025, after falling to $80.6K, Bitcoin traded sideways for almost two months. It did not fall below the low of $80.6K, but tried to climb past $94K. It briefly succeeded in mid-January, reaching a high of $97,924.
The similarities between the price action then and now mean that a similar outcome could come about now.
We found that the on-chain metrics did not yet show a complete capitulation of market participants. There may be room for a BTC price drop. However, after the recent sell-off, a few weeks of dull, sideways price action is a possibility.
However, traders should note that even in the event of a relief rally towards $66K-$68K, new lows below $59K could likely occur later this year.
Final Summary
- Bitcoin’s on-chain metrics showed deteriorating market conditions and sentiment.
- Similarities in the price action between late November 2025 and this past week suggest some consolidation and a brief rebound could be possible before the next sell-off.