

Bitcoin price corrects gains below $112,500. BTC could continue to decline if it remains below the USD 112,000 resistance.
- Bitcoin started a downside correction below the $112,000 support.
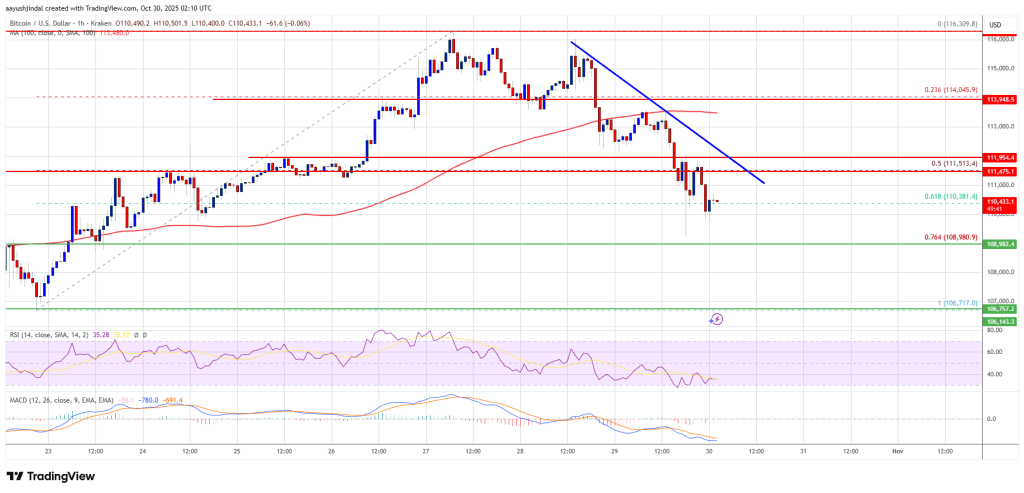
- The price is trading below $112,000 and the 100 hourly Simple Moving Average.
- A bearish trendline is forming with resistance at $111,500 on the hourly chart of the BTC/USD pair (data feed from Kraken).
- The pair could continue to decline if it trades below the $108,800 zone.
Bitcoin price continues to fall
Bitcoin price failed to hold above the $113,500 pivot level and extended losses. BTC fell below USD 112,500 and USD 112,000 to enter a bearish zone.
The decline was such that the price traded below the 61.8% Fib retracement level of the upward move from the $106,718 swing low to the $116,310 high. Furthermore, a bearish trendline is forming with resistance at $111,500 on the hourly chart of the BTC/USD pair.
Bitcoin is now trading below $112,000 and the 100 hourly Simple Moving Average. If the bulls attempt another surge, the price may encounter resistance near the $111,500 level and the trendline. The first major resistance is around the $112,000 level.
The next resistance could be $112,500. A close above the resistance at $112,500 could send the price higher. In the mentioned case, the price could rise and test the USD 113,200 resistance. Any further gains could send the price towards the USD 113,500 level. The next threshold for the bulls could be $115,000 and $115,500.
Lose more in BTC?
If Bitcoin fails to rise above the $112,500 resistance zone, the price may continue to decline. Immediate support is approaching the $110,000 level. The first major support is near the $108,800 level or the 76.4% Fib retracement level of the upward move from the $106,718 swing low to the $116,310 high.
The next support is now near the $108,000 zone. Any further losses could send the price towards the $106,500 support in the short term. The key support is at $103,500, below which BTC could struggle to recover in the near term.
Technical indicators:
Hourly MACD – The MACD is now gaining speed in the bearish zone.
Hourly RSI (Relative Strength Index) – The RSI for BTC/USD is now below the 50 level.
Major support levels – $108,800, followed by $108,000.
Major resistance levels – $111,500 and $112,000.