

Bitcoin price recovered above the USD 60,000 resistance zone. BTC is now struggling to break the USD 61,200 and USD 61,500 resistance levels.
- Bitcoin started a recovery wave above the $60,000 resistance zone.
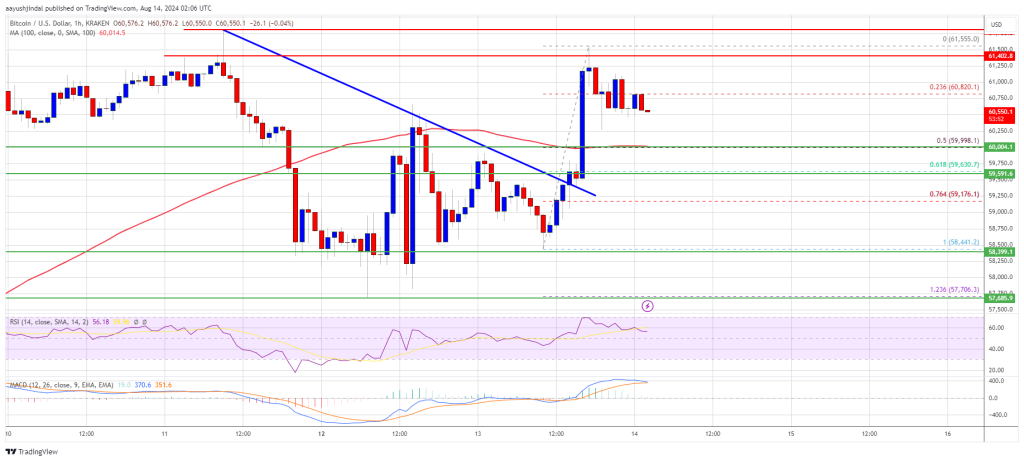
- The price is trading above $60,000 and the 100 hourly Simple Moving Average.
- There was a break above a connecting bearish trendline with resistance at $59,500 on the hourly chart of the BTC/USD pair (data feed from Kraken).
- The pair could attempt another rise if it breaks above the $61,500 resistance zone.
Bitcoin price builds momentum
Bitcoin price started a decent upward move above the USD 58,500 resistance zone. BTC was able to break the USD 59,500 and USD 60,000 resistance levels.
There was a break above a connecting bearish trendline with resistance at $59,500 on the hourly chart of the BTC/USD pair. It even spiked above the USD 61,500 level. It reached a high at $61,555 and the price is now correcting gains.
There was a move below the USD 61,200 and USD 61,000 levels. The price fell below the 23.6% Fib retracement level of the upward move from the $58,441 swing low to the $61,555 high.
Bitcoin price is now trading above $60,000 and the 100 hourly Simple Moving Average. It is also well above the 50% Fib retracement level of the upward move from the $58,441 swing low to the $61,555 high. On the upside, the price could encounter resistance near the USD 61,200 level.
The first major resistance is near the $61,500 level. A clear move above the USD 61,500 resistance could push the price further higher in the coming sessions. The next major resistance could be at USD 62,500.
The next big hurdle is at $63,500. A close above the $63,500 resistance could provide more upside. In the mentioned case, the price could rise and test the USD 65,000 resistance.
Another drop in BTC?
If Bitcoin fails to rise above the USD 61,500 resistance zone, it could trigger another decline. The immediate downside support is near the $60,000 level and the 100 hourly Simple Moving Average.
The first major support is at $59,650. The next support is now near the $59,150 zone. Any further losses could send the price towards the $58,500 support zone or even $57,200 in the near term.
Technical indicators:
Hourly MACD – The MACD is now losing pace in the bullish zone.
Hourly RSI (Relative Strength Index) – The RSI for BTC/USD is now above the 50 level.
Major support levels – USD 60,000, followed by USD 59,650.
Major resistance levels – $61,200 and $61,500.