Close Menu
  • News
    • Bitcoin
    • Altcoins
    • DeFi
    • Market Cap
  • Blockchain
  • Web 3
    • NFT
    • Metaverse
  • Regulation
  • Analysis
  • Learn
  • Blog
What's Hot

What BEP2 holders need to know

2026-03-07

Pakistan’s Top 10 SEO Experts Who Actually Move the Needle

2026-03-07

$1.2 Billion Liquidity Warning – How BlackRock Could ‘Shake Up’ the Crypto Market

2026-03-07
Facebook X (Twitter) Instagram
  • Contact
  • Terms & Conditions
  • Privacy Policy
  • DMCA
  • Advertise
Facebook X (Twitter) Instagram
Bitcoin Platform – Bitcoin | Altcoins | Blockchain | News Stories Updated Daily
  • News
    • Bitcoin
    • Altcoins
    • DeFi
    • Market Cap
  • Blockchain

    What BEP2 holders need to know

    2026-03-07

    SoFi uses BitGo to power the distribution of its SoFiUSD stablecoin

    2026-03-07

    Interoperability is ‘essential’ for digital assets to reach their full potential: DTCC

    2026-03-07

    A groundbreaking leap into the consumer future of decentralized AI

    2026-03-07

    BitGo to Power SoFiUSD Stablecoin Infrastructure as SoFi Launches First Nationally Chartered Bank Token

    2026-03-07
  • Web 3
    • NFT
    • Metaverse
  • Regulation

    Refusing new IRS crypto tax forms could cost you your exchange account

    2026-03-07

    US lawmakers consider ban on prediction markets amid bets on Iran

    2026-03-06

    De volatiliteit van Bitcoin zou in april kunnen exploderen als SEC de markt achter de ETF-leverage beoordeelt

    2026-03-06

    Crypto company Kraken secures a direct link to Federal Reserve payments

    2026-03-04

    Bitcoin’s $85 billion derivatives engine may move onshore as CFTC eyes April approval

    2026-03-04
  • Analysis

    XRP Bull Flag Breakout After 8-Month Consolidation to Send Price to $11

    2026-03-07

    Billionaire Peter Thiel dumps a $74,400,000 stake in three assets, including one of Warren Buffett’s favorites

    2026-03-07

    Bitcoin Price Rally Slows, Consolidation Signals Possible Next Step

    2026-03-07

    XRP Price Ladder Shows What Conditions Are Needed for $18, $100, and $500

    2026-03-07

    Bitcoin’s rally from $73,000 faces a crucial test as momentum looks to change

    2026-03-06
  • Learn

    What Is Wrapped ETH (WETH) and Why Do You Need It in DeFi?

    2026-03-06

    What Is Crypto Protocol and Why Coins Need It

    2026-03-04

    Wat is Liquid Proof-of-Stake: uitgelegd voor beginners

    2026-03-02

    The 9 Most Common Crypto Scam Types

    2026-03-02

    Sidechains Explained: What They Are, How They Work, and Why They Matter

    2026-02-20
  • Blog
Bitcoin Platform – Bitcoin | Altcoins | Blockchain | News Stories Updated Daily
Home»Altcoins»Key indicators point to further losses up to $12
Altcoins

Key indicators point to further losses up to $12

2024-08-01No Comments3 Mins Read
Share
Facebook Twitter LinkedIn Pinterest Email

Chain link (LINK), one of the major players in the decentralized finance space, is currently facing increasing bearish pressure in the market. While LINK is bearish momentum continues to grow, key technical indicators signal the potential for further losses towards the critical $12 support level for the cryptocurrency. With this current price movement, Chainlink could continue to decline, potentially testing lower support levels in the near future unless there is a significant turnaround in market sentiment.

This article provides an in-depth analysis by evaluating current market sentiment surrounding Chainlink, examining key technical indicators and identifying critical support levels along with their implications for LINK price stability.

At the time of writing, it had a market capitalization of over $7.7 billion and a trading volume of over $243 million. LINK fell 3.75% to trade at around $12.82. Over the past 24 hours, both the asset’s market capitalization and trading volume have fallen by 3.72 and 1.67 respectively.

Assessment of current market sentiment surrounding Chainlink

Given the asset’s price movements, it appears that current market sentiment around LINK is still negative. The price is currently actively trading below the 100-day Simple Moving Average (SMA), towards $12 on the 4-hour chart. This suggests that the bearish trend could continue. With more selling pressure, this position indicates that Chainlink is likely to fall further as long as it remains below the SMA.

Chain link
Source: LINKUSDT on Tradingview.com

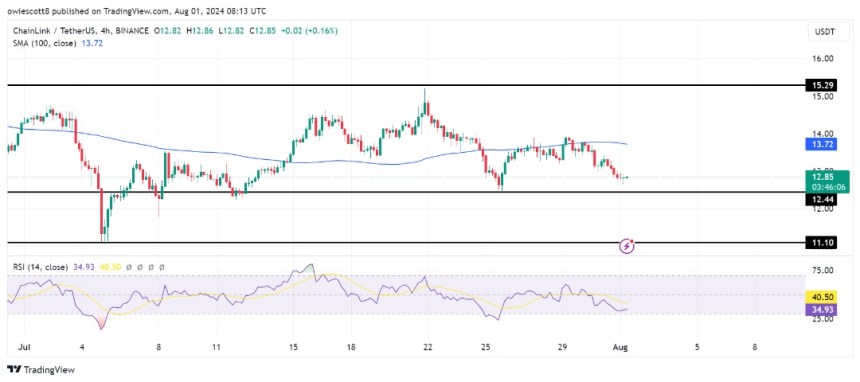
The 4-hour Relative Strength Index (RSI) signal line has successfully fallen below 50% into the oversold zone. This suggests that selling pressure is increasing and the asset may experience further downward movement towards the $12.44 level.

See also  What Ethereum's rising burn rate says about the network

On the 1-day chart, LINK’s market sentiment is also negative, with the price trading below the 100-day SMA. LINK is showing a bearish trend as it moves towards the $12.44 support level after forming two bearish candlesticks. If the price falls below this key level, it could signal further bearish momentum and potentially drive the price towards other support levels.

Chain link
Source: LINKUSDT on Tradingview.com

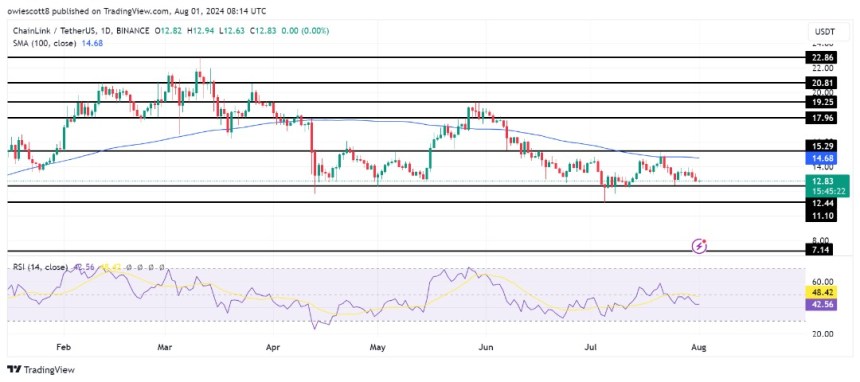
Finally, the 1-day RSI has also fallen below 50%, further supporting the possibility of further price decline. This decline suggests that bearish pressure increases because sellers are still active and influential in the market. The fact that sellers are still active implies that LINK will likely continue to decline.

Identify critical support and resistance levels

Chainlink is currently on a bearish path, heading towards the $12.44 support level. If the price breaks and closes below the $12.44 support level, it could continue its bearish move towards the next support range at $11.10 and possibly even lower levels.

However, if the digital asset encounters resistance at $12.44 and fails to do so pause below, this could lead to a potential upside move reaching the $15.25 resistance mark. Should the price rise above this level, continue profits could occur, targeting the $17.96 resistance point and beyond.

Chain link
LINK is trading at $12.97 on the 1D chart | Source: LINKUSDT on Tradingview.com

Featured image from YouTube, chart from Tradingview.com

Source link

Indicators Key losses point
Share. Facebook Twitter Pinterest LinkedIn Tumblr Email

Related Posts

Analyst Predicts Conservative XRP Price If It Follows 2017 Run

2026-03-07

Bitcoin is losing steam – $66,000 now the line between recovery and crash

2026-03-07

Ethereum Rising Wedge Warning: A disruption could send the price to $1,500

2026-03-07

Bitcoin On-Chain Data Identifies Unusual Market Cap Behavior

2026-03-07
Add A Comment

Comments are closed.

Top Posts

Degen Toonz & CULT&RAIN are at the forefront of digital fashion

2023-07-01

Help network partners with IQ.wiki to strengthen users’ understanding of Web3

2024-12-12

Stacks (STX) are up 29% in the last 7 days

2023-06-24
Editors Picks

XRP price bounces above $0.50 as markets turn red

2024-11-04

Lima becomes Innovation -Picentrum with Meta Pool and NTT Data Hackathon

2025-05-25

Bitcoin Rise to $64,000 Causes Coinbase to Crash

2024-02-29

Why have traders been bullied at Uniswap?

2023-10-20

Our mission is to develop a community of people who try to make financially sound decisions. The website strives to educate individuals in making wise choices about Cryptocurrencies, Defi, NFT, Metaverse and more.

We're social. Connect with us:

Facebook X (Twitter) Instagram Pinterest YouTube
Top Insights

What BEP2 holders need to know

Pakistan’s Top 10 SEO Experts Who Actually Move the Needle

$1.2 Billion Liquidity Warning – How BlackRock Could ‘Shake Up’ the Crypto Market

Get Informed

Subscribe to Updates

Get the latest news and Update from Bitcoin Platform about Crypto, Metaverse, NFT and more.

  • Contact
  • Terms & Conditions
  • Privacy Policy
  • DMCA
  • Advertise
© 2026 Bitcoinplatform.com - All rights reserved.

Type above and press Enter to search. Press Esc to cancel.