Close Menu
  • News
    • Bitcoin
    • Altcoins
    • DeFi
    • Market Cap
  • Blockchain
  • Web 3
    • NFT
    • Metaverse
  • Regulation
  • Analysis
  • Learn
  • Blog
What's Hot

Here’s why Bitcoin price shouldn’t fall to $54,000: Analyst

2026-03-07

Expert Says XRP Price Could Reach $1,000 By The End Of 2026 If This Happens

2026-03-07

What BEP2 holders need to know

2026-03-07
Facebook X (Twitter) Instagram
  • Contact
  • Terms & Conditions
  • Privacy Policy
  • DMCA
  • Advertise
Facebook X (Twitter) Instagram
Bitcoin Platform – Bitcoin | Altcoins | Blockchain | News Stories Updated Daily
  • News
    • Bitcoin
    • Altcoins
    • DeFi
    • Market Cap
  • Blockchain

    What BEP2 holders need to know

    2026-03-07

    SoFi uses BitGo to power the distribution of its SoFiUSD stablecoin

    2026-03-07

    Interoperability is ‘essential’ for digital assets to reach their full potential: DTCC

    2026-03-07

    A groundbreaking leap into the consumer future of decentralized AI

    2026-03-07

    BitGo to Power SoFiUSD Stablecoin Infrastructure as SoFi Launches First Nationally Chartered Bank Token

    2026-03-07
  • Web 3
    • NFT
    • Metaverse
  • Regulation

    Refusing new IRS crypto tax forms could cost you your exchange account

    2026-03-07

    US lawmakers consider ban on prediction markets amid bets on Iran

    2026-03-06

    De volatiliteit van Bitcoin zou in april kunnen exploderen als SEC de markt achter de ETF-leverage beoordeelt

    2026-03-06

    Crypto company Kraken secures a direct link to Federal Reserve payments

    2026-03-04

    Bitcoin’s $85 billion derivatives engine may move onshore as CFTC eyes April approval

    2026-03-04
  • Analysis

    XRP Bull Flag Breakout After 8-Month Consolidation to Send Price to $11

    2026-03-07

    Billionaire Peter Thiel dumps a $74,400,000 stake in three assets, including one of Warren Buffett’s favorites

    2026-03-07

    Bitcoin Price Rally Slows, Consolidation Signals Possible Next Step

    2026-03-07

    XRP Price Ladder Shows What Conditions Are Needed for $18, $100, and $500

    2026-03-07

    Bitcoin’s rally from $73,000 faces a crucial test as momentum looks to change

    2026-03-06
  • Learn

    What Is Wrapped ETH (WETH) and Why Do You Need It in DeFi?

    2026-03-06

    What Is Crypto Protocol and Why Coins Need It

    2026-03-04

    Wat is Liquid Proof-of-Stake: uitgelegd voor beginners

    2026-03-02

    The 9 Most Common Crypto Scam Types

    2026-03-02

    Sidechains Explained: What They Are, How They Work, and Why They Matter

    2026-02-20
  • Blog
Bitcoin Platform – Bitcoin | Altcoins | Blockchain | News Stories Updated Daily
Home»Analysis»XRP dominance reveals the start of the next parabolic price move
Analysis

XRP dominance reveals the start of the next parabolic price move

2023-10-20No Comments3 Mins Read
Share
Facebook Twitter LinkedIn Pinterest Email

Crypto analyst Jaydee recently took to X (formerly Twitter) and shared another intriguing chart of XRP. The analyst presented the 2-month XRP dominance chart from 2014 to today, which sheds light on the cryptocurrency’s historical and potential future price action. This research brings the focus to a descending trendline and a horizontal resistance line, showing a critical XRP dominance level of 2.62%, which could be crucial for the price’s next parabolic move.

XRP dominance is just below the key level

The chart delves into its historical performance and shows moments when the token experienced rapid rises and furious falls in terms of crypto market dominance. There was a period when XRP experienced a staggering 39x price increase, reaching $0.39 in just 56 days in 2017. Shortly after, the digital asset surged 17x within 28 days, taking its value to $3.31.

XRP dominance, 2 month chart
XRP Dominance, 2 Month Chart | Source:

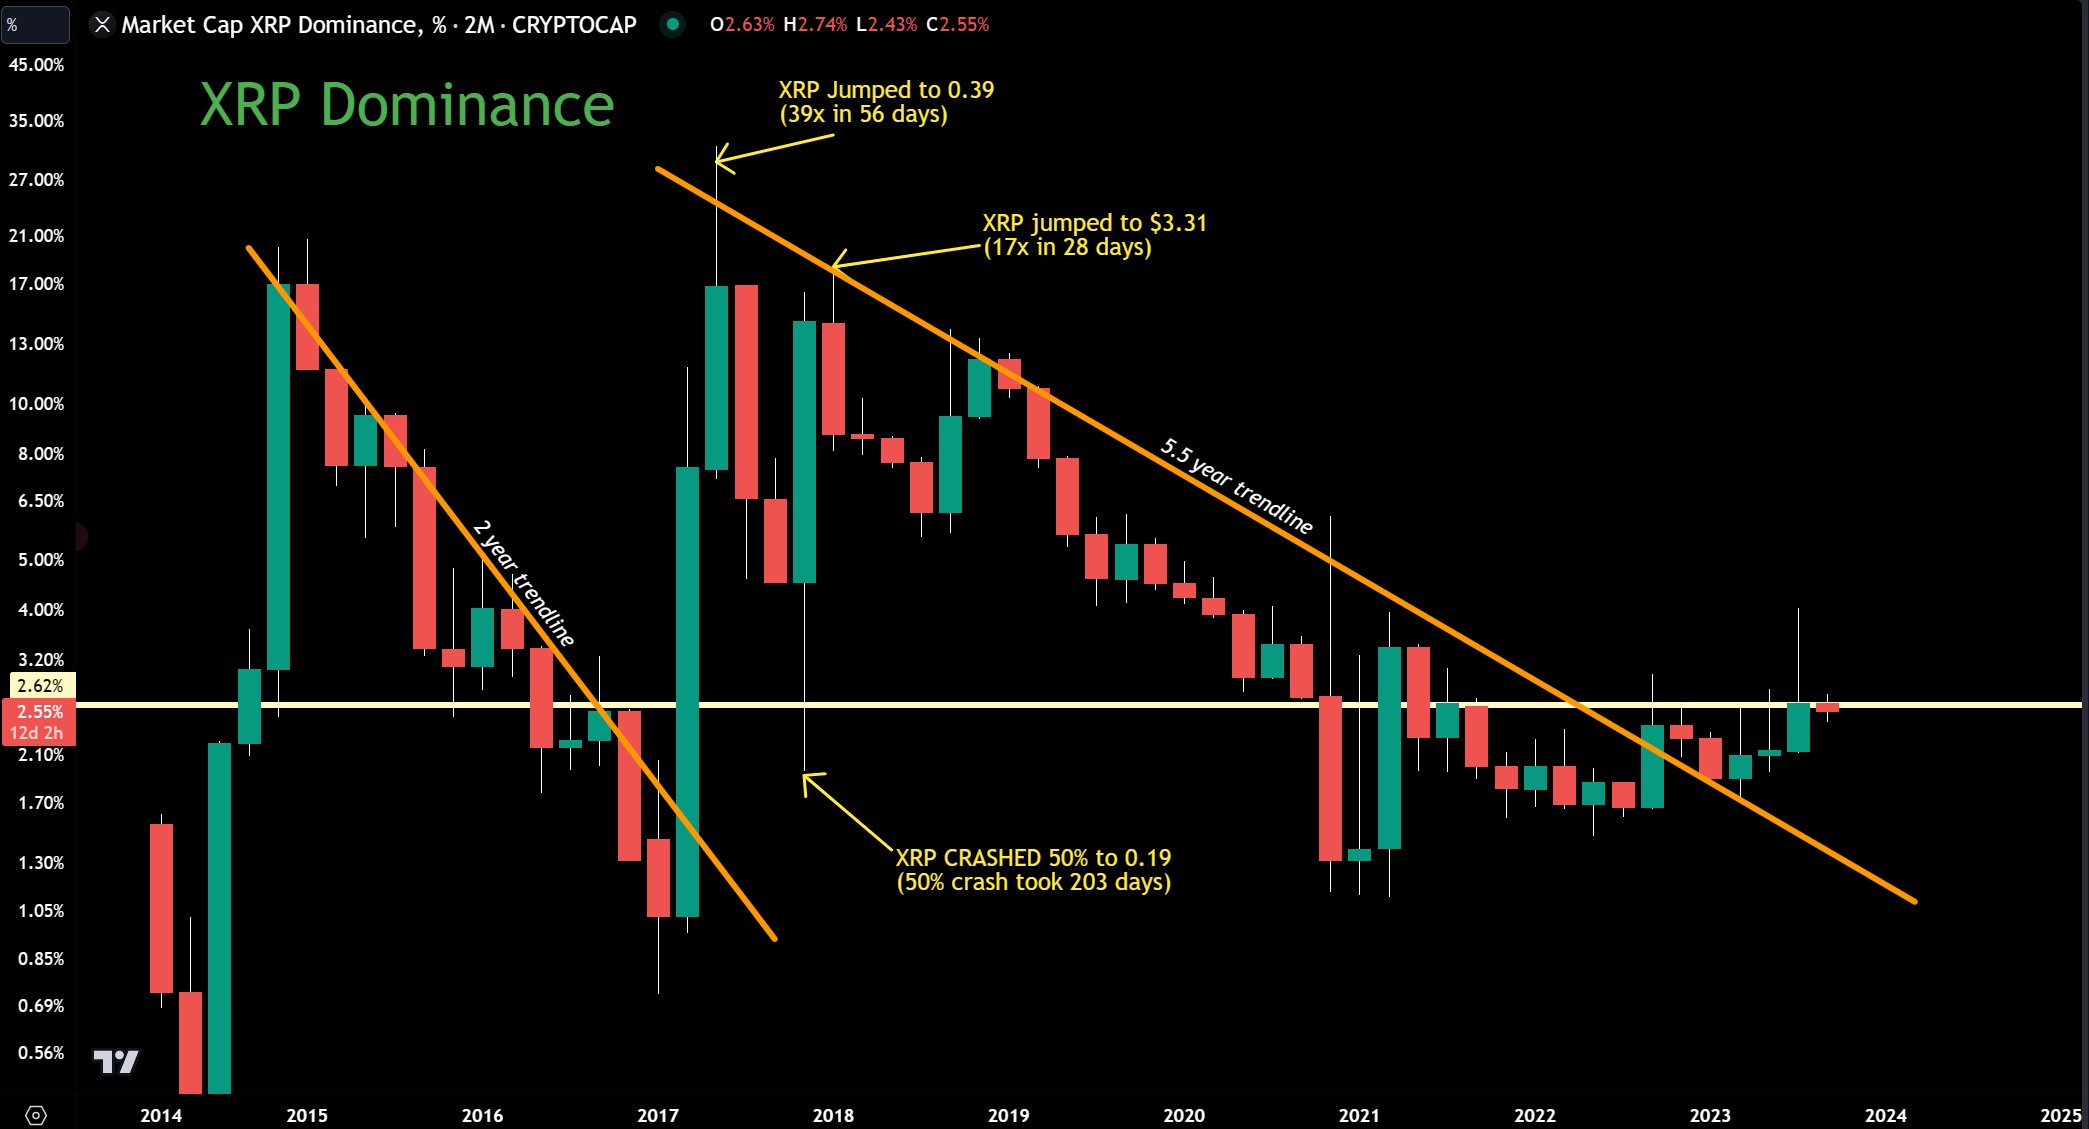
Both times dominance was rejected on the yellow 5.5 year trend line. This resistance line has consistently served as a major barrier to XRP’s dominance in the crypto market. Any approach or touch to this line led to significant price action to the downside.

Remarkably, the cryptocurrency’s price experienced a similar situation from 2015 to 2017, when its dominance was also held below a declining trendline for more than two years. However, the breakout of this trend meant a massive price increase, as XRP’s dominance rose from just 1% to over 30% in just four months in 2017.

Fast forward to today, the cryptocurrency could be in a similar situation as it was in 2017. It has broken the trend and is moving past the red trendline. However, instead of an immediate increase like in 2017, XRP’s dominance is now struggling with the crucial limit of 2.62%.

See also  The Fed's rate cut won't happen because capital rotates to obscure transactions instead of Bitcoin, says Arthur Hayes

According to the analyst’s chart, it is currently at 2.55%, narrowly missing the critical level. Notably, dominance has not reached a close above 2.62% on the two-month chart over the past fourteen months. However, if it crosses this threshold, it could signal the start of the next parabolic ascent, as outlined by Jaydee.

Currently reaching the yellow resistance line. If we can get a full two-month candle above the yellow resistance line, expect the next parabolic move! Is 2024 the year?

Weekly chart: when ‘moon’?

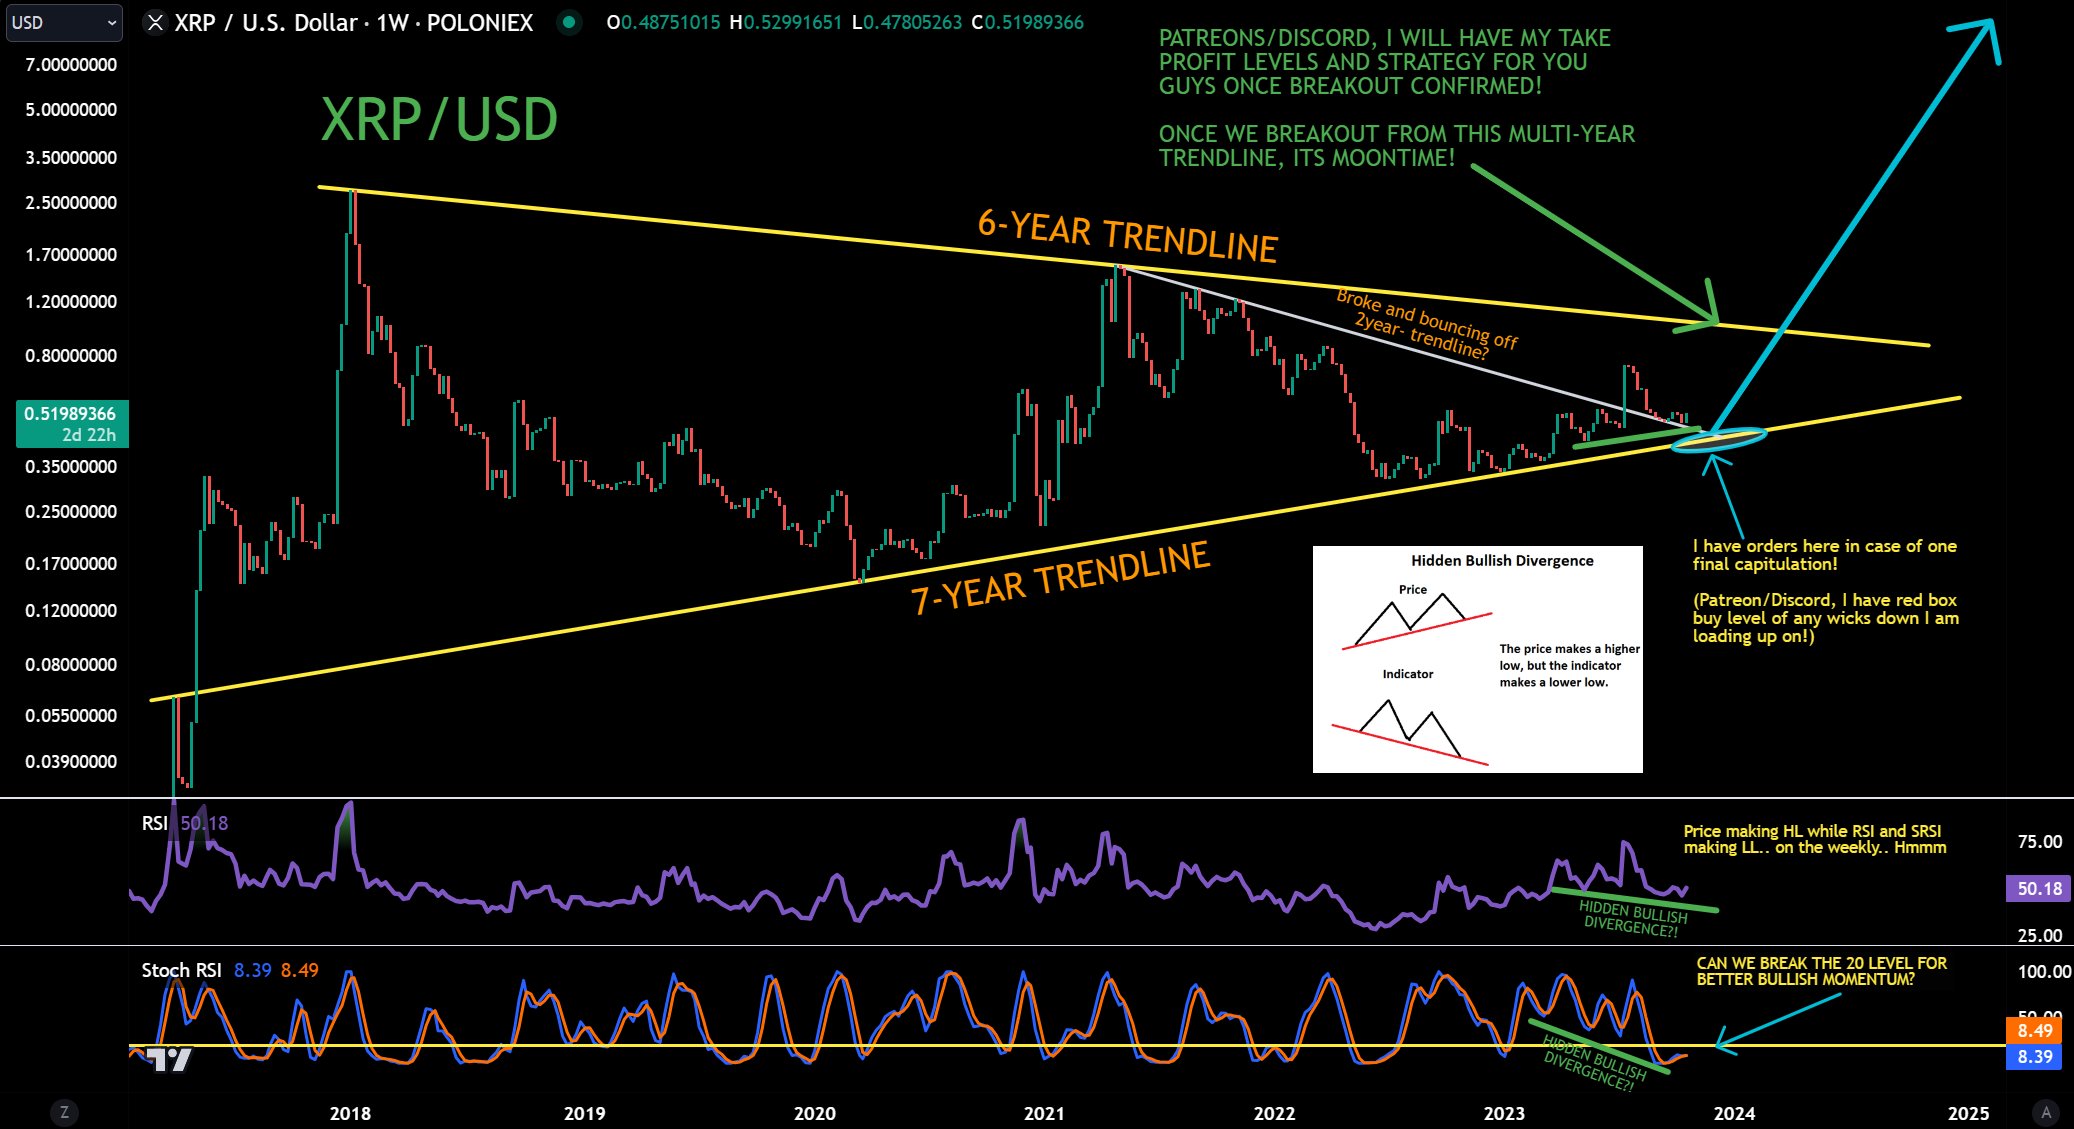
Jaydee shared another graphic on X (formerly Twitter) today, regarding the weekly on the 2-year trend line.” From this he distinguishes three important things before XRP can ’emerge’.

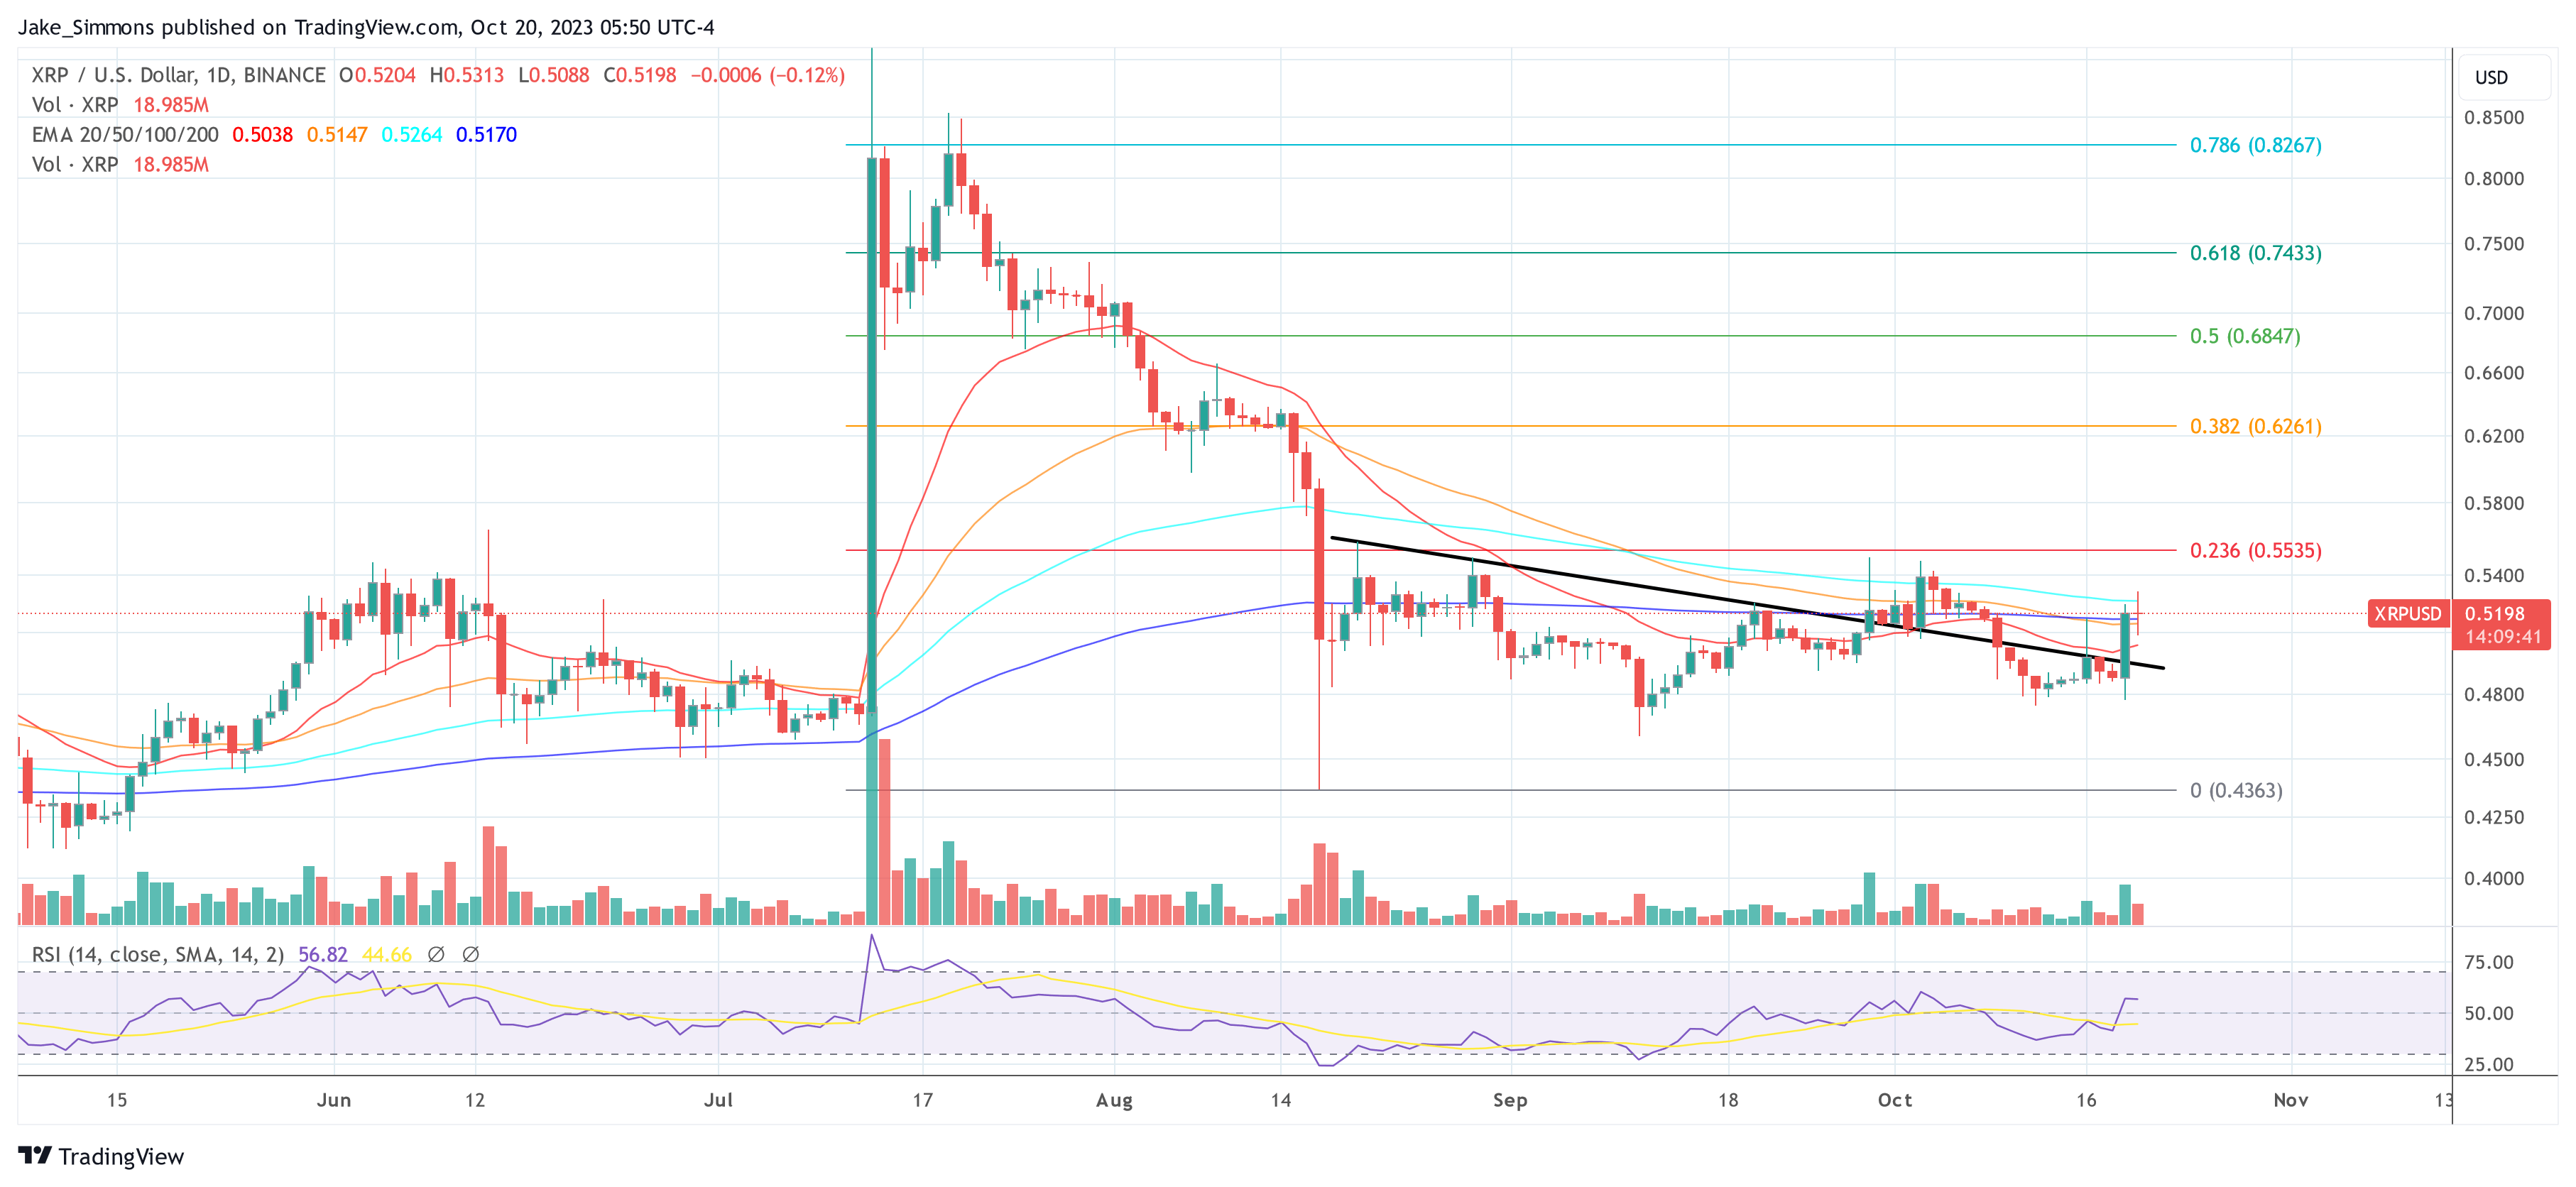
First, the cryptocurrency needs to gain momentum. He suggests that the price should rise above $0.54, at least on the daily chart. Second, the Stochastic RSI (SRSI) for the weekly time frame should cross the 20 level, indicating potential for a bullish move. Finally, the key point in Jaydee’s analysis is the yellow six-year trend line. If XRP wants to witness a parabolic move, breaking this trendline is imperative.

XRP USD chart
XRP/USD Weekly Chart | Source:

At the time of writing, XRP was trading at 0.5198.

XRP price
XRP rises above the 200D EMA, 1-day chart | Source: XRPUSD on TradingView.com

Featured image from iStock, chart from TradingView.com


Source link

Dominance Move Parabolic Price reveals Start XRP
Share. Facebook Twitter Pinterest LinkedIn Tumblr Email

Related Posts

Here’s why Bitcoin price shouldn’t fall to $54,000: Analyst

2026-03-07

Expert Says XRP Price Could Reach $1,000 By The End Of 2026 If This Happens

2026-03-07

Pakistan’s Top 10 SEO Experts Who Actually Move the Needle

2026-03-07

Analyst Predicts Conservative XRP Price If It Follows 2017 Run

2026-03-07
Add A Comment

Comments are closed.

Top Posts

Bitcoin Advanced N / A shows no signs of delaying bullish momentum – details

2025-05-25

Can Bulls Cause a Higher Wave?

2024-07-16

Solana sellers should beware of this buying zone

2023-09-09
Editors Picks

$100,000 Bitcoin is in store if BTC climbs back above major resistance level, says top trader – but there’s a catch

2024-07-05

This analyst says Bitcoin hasn’t peaked yet, and data may be able to back him up

2025-10-20

Solana (SOL) picks up speed, triggering another upward run

2026-01-09

Hashed Research CEO appointed chief policy officer at the presidential office of Korea

2025-06-08

Our mission is to develop a community of people who try to make financially sound decisions. The website strives to educate individuals in making wise choices about Cryptocurrencies, Defi, NFT, Metaverse and more.

We're social. Connect with us:

Facebook X (Twitter) Instagram Pinterest YouTube
Top Insights

Here’s why Bitcoin price shouldn’t fall to $54,000: Analyst

Expert Says XRP Price Could Reach $1,000 By The End Of 2026 If This Happens

What BEP2 holders need to know

Get Informed

Subscribe to Updates

Get the latest news and Update from Bitcoin Platform about Crypto, Metaverse, NFT and more.

  • Contact
  • Terms & Conditions
  • Privacy Policy
  • DMCA
  • Advertise
© 2026 Bitcoinplatform.com - All rights reserved.

Type above and press Enter to search. Press Esc to cancel.