

Litecoin price fell sharply below $80 and $70 against the US dollar. LTC is attempting a recovery wave, but benefits may be limited above $70.
- Litecoin corrects losses from the $56 support zone against the US dollar.
- The price is now trading below USD 70 and the 100 simple moving average (4 hours).
- A major bearish trendline is forming with resistance near USD 66.00 on the 4-hour chart of the LTC/USD pair (data feed from Kraken).
- The price might recover above USD 66, but the bears might remain active near USD 70.
Litecoin price starts recovery
The past week saw a sharp decline in Bitcoin, Ethereum, Litecoin and other altcoins against the US dollar. The LTC price topped near USD 85 before starting a fresh decline.
There was a sharp drop below $80 and $70. The price even dropped below $60. It traded as low as $55.78 and recently started an upside correction. There was a small rise above the $60 resistance level. The price climbed above the 23.6% Fib retracement level of the downward move from the $85.39 swing high to the $55.78 low.
Litecoin is now trading below USD 70 and the 100 simple moving average (4 hours). A major bearish trendline is also forming with resistance near USD 66.00 on the 4-hour chart of the LTC/USD pair.
On the upside, immediate resistance is near the $66 zone. The next major resistance is near the $70 level. It is close to the 50% Fib retracement level of the downward move from the $85.39 swing high to the $55.78 low. If there is a clear break above the USD 70 resistance, the price could rise sharply again.
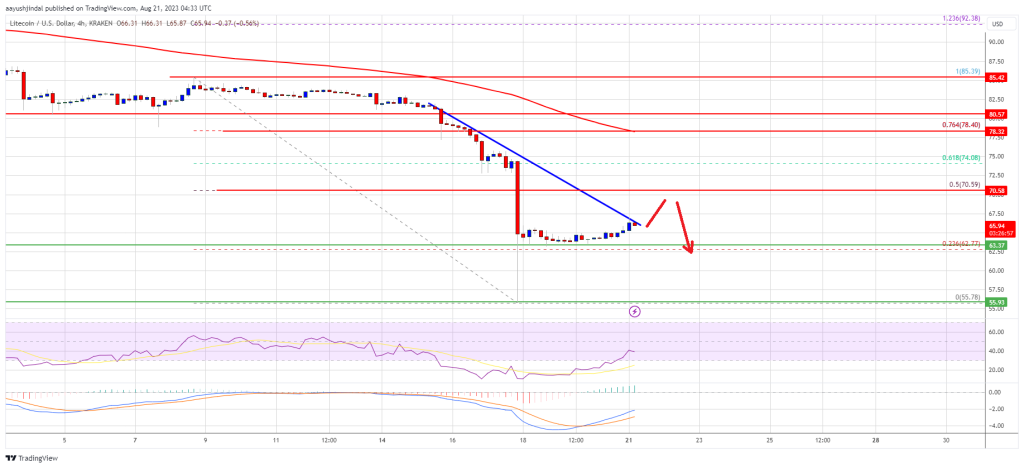
Source: LTCUSD at TradingView.com
In the said case, the price is likely to continue higher towards $75 and $78. More gains may push the price of LTC to the $85 resistance zone.
New decline in LTC?
If the Litecoin price fails to cross the $70 resistance level, there could be another drop. The first support on the downside is near the $63.50 level.
The next major support is forming near the USD 60 level, below which there is a risk of a move towards the USD 56.00 support. Any further losses might push the price towards the $52 support.
Technical indicators:
4-hour MACD – The MACD is now gaining pace in the bullish zone.
4-hour RSI (Relative Strength Index) – The RSI for LTC/USD is still below the 50 level.
Key Support Levels – $63.50 followed by $60.00.
Major Resistance Levels – $66.00 and $70.00.