

The Ethereum price started to rise again and remained stable above $2,380. ETH is now correcting gains and could fall if it trades below $2,300.
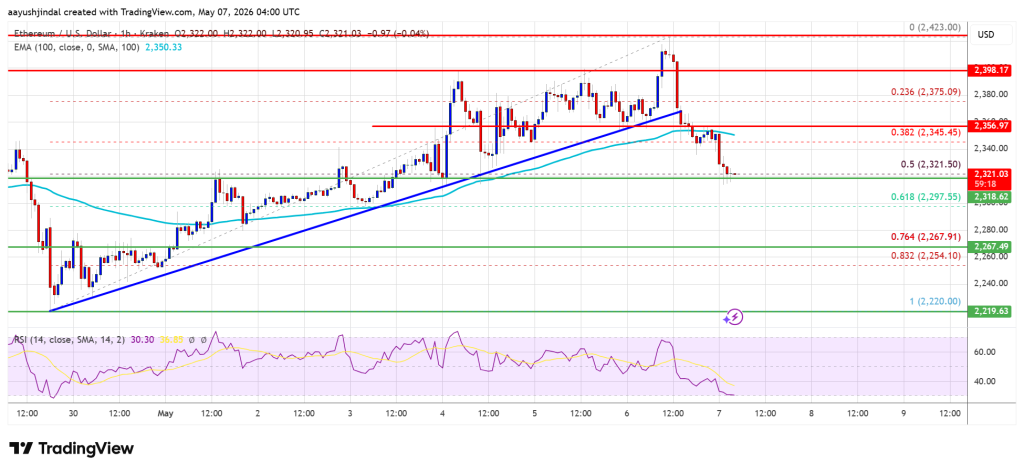
- Ethereum started a downward correction from the $2,420 zone.
- The price is trading below $2,350 and the 100-hourly Simple Moving Average.
- There was a break below a bullish trendline with support at $2,365 on the hourly chart of ETH/USD (data feed via Kraken).
- The pair could continue to decline if it remains below the $2,365 zone.
Ethereum price cuts gains
Ethereum price managed to stay above the USD 2,320 support and started a new increase, just like Bitcoin. ETH price gained pace and rose above USD 2,380 and USD 2,385.
However, the bears were active around $2,420. The last swing high was formed at $2,423 before a downward correction took place. The price fell below the $2,365 level. Additionally, there was a break below a bullish trendline with support at $2,365 on the hourly chart of ETH/USD.
The price even tested the 50% Fib retracement level of the upward move from the $2,220 swing low to the $2,423 high. Ethereum price is now trading below $2,360 and the 100-hourly Simple Moving Average.
If the bulls continue to act above $2,300, the price could rise again. Immediate resistance is seen around the $2,350 level. The first major resistance is near the $2,380 level. The next major resistance is around the $2,420 level. A clear move above the USD 2,420 resistance could send the price towards the USD 2,450 resistance. An upside break above the $2,450 region could lead to more gains in the coming days. In the mentioned case, Ether could rise towards the USD 2,500 or even USD 2,550 resistance zone in the short term.
Another drop in ETH?
If Ethereum fails to clear the USD 2,360 resistance, it could initiate a downward correction. The initial downside support is near the $2,320 level. The first major support is near the $2,300 zone.
A clear move below the $2,300 support could push the price towards the $2,265 support or the 76.4% Fib retracement level of the upward move from the $2,220 swing low to the $2,423 high. Any further losses could send the price towards $2,200. The main support could be at $2,150.
Technical indicators
hourly MACD – The MACD for ETH/USD is losing momentum in the bullish zone.
RSI per hour – The RSI for ETH/USD is now below the 50 zone.
Major support level – $2,300
Major resistance level – $2,360