

Bitcoin price started a recovery wave above the $75,000 zone. BTC is consolidating and could target more gains if it breaks the USD 77,350 resistance zone.
- Bitcoin managed to form a base above $74,500 and started a recovery wave.
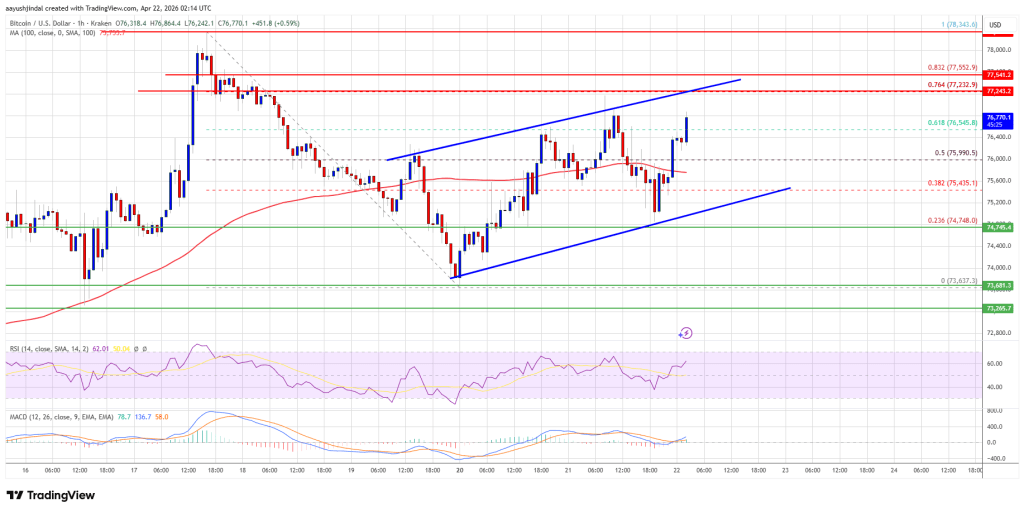
- The price is trading above $75,500 and the 100 hourly moving average.
- A rising channel is forming with resistance at $77,350 on the hourly chart of the BTC/USD pair (data feed from Kraken).
- The pair could gain bullish momentum if it settles above the $77,500 zone.
Bitcoin price regains traction
Bitcoin price remained supported above the $74,000 zone. BTC formed a base and settled above $74,500 to start a recovery wave. There was a move above the USD 75,000 and USD 75,500 levels.
The bulls were able to push the price above the 61.8% Fib retracement level of the downward move from the $78,344 swing high to the $73,637 low. An ascending channel is also forming with resistance at $77,350 on the hourly chart of the BTC/USD pair.
Bitcoin is now trading above $75,500 and the 100 hourly moving average. If the price remains stable above $75,000, another increase can be attempted. Immediate resistance is near the $77,250 level and the 76.4% Fib retracement level of the downward move from the $78,344 swing high to the $73,637 low.
The first major resistance is around the $77,350 level. A close above the resistance at $77,350 could send the price higher. In the mentioned case, the price could rise and test the USD 78,000 resistance. Any further gains could send the price towards the USD 78,500 level. The next barrier for the bulls could be $80,000.
Another drop in BTC?
If Bitcoin fails to rise above the USD 77,350 resistance zone, it could trigger another decline. Immediate support is near the $76,000 level.
The first major support is near the $75,650 level. The next support is now near the $75,400 zone. Any further losses could send the price towards the USD 74,250 support in the near term. The key support now lies at $73,200, below which BTC could struggle to recover in the near term.
Technical indicators:
Hourly MACD – The MACD is now gaining speed in the bullish zone.
Hourly RSI (Relative Strength Index) – The RSI for BTC/USD is now above the 50 level.
Major support levels – USD 76,000, followed by USD 75,400.
Major resistance levels – $77,250 and $78,000.