

Bitcoin price started a new increase and reached the $64,500 zone. BTC is consolidating and could aim for more gains above the USD 66,200 level.
- Bitcoin managed to stay above $62,500 and started a new increase.
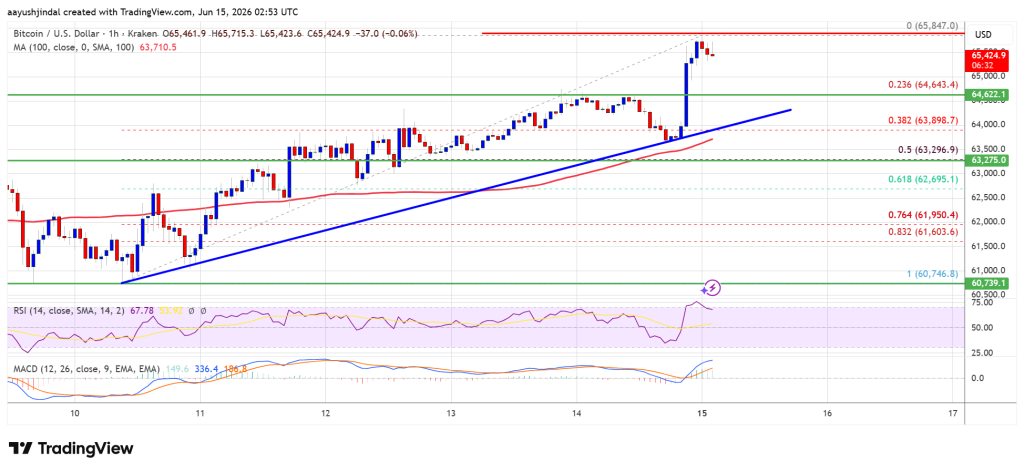
- The price is trading above USD 64,500 and the 100 hourly moving average.
- A bullish trendline is forming with support at $64,200 on the hourly chart of the BTC/USD pair (data feed from Kraken).
- The pair could extend gains if it remains above the USD 65,500 and USD 66,200 levels.
Bitcoin price regains strength
Bitcoin price found support near $60,800 and started a new increase. BTC gained pace for a move above the USD 61,500 and USD 63,200 resistance levels.
The bulls even pushed the price above $64,500. A high was formed at $65,847, and the price entered a consolidation phase above the 23.6% Fib retracement level of the upward move from the $60,746 swing low to the $65,847 high.
Bitcoin is now trading above $64,500 and the 100 hourly moving average. Moreover, a bullish trendline is forming with support at $64,200 on the hourly chart of the BTC/USD pair.
If the price remains stable above $64,500, another move up could be attempted. The immediate resistance is near the $65,500 level. The first major resistance is around the $66,200 level. A close above the USD 66,200 resistance could send the price rising further. In the mentioned case, the price could rise and test the USD 66,800 resistance. Any further gains could send the price towards the USD 67,500 level. The next barrier for the bulls could be $68,000.
Another drop in BTC?
If Bitcoin fails to rise above the USD 66,200 resistance zone, it could trigger another decline. The immediate support is near the $64,650 level. The first major support is near the $64,200 level.
The next support now lies near the $63,300 zone or the 50% Fib retracement level of the upward move from the $60,746 swing low to the $65,847 high. Any further losses could send the price towards the USD 62,500 support in the short term. The key support is now at $61,800, below which BTC may struggle to recover in the short term.
Technical indicators:
Hourly MACD – The MACD is now losing pace in the bullish zone.
Hourly RSI (Relative Strength Index) – The RSI for BTC/USD is now above the 50 level.
Major support levels – USD 64,650, followed by USD 64,200.
Major resistance levels – $65,500 and $66,200.