
 needs a break from $0.10 or faces another downward move")
Dogecoin started a recovery wave above the $0.0940 zone against the US dollar. DOGE is now facing hurdles near USD 0.0975 and could struggle to continue higher.
- DOGE price started a recovery wave from USD 0.0925 and climbed above USD 0.0940.
- The price is trading above the USD 0.0950 level and the 100-hour simple moving average.
- An ascending channel is forming with resistance at $0.0970 on the hourly chart of the DOGE/USD pair (Kraken data source).
- The price could continue to rise if it remains above $0.0925.
Dogecoin price encounters resistance
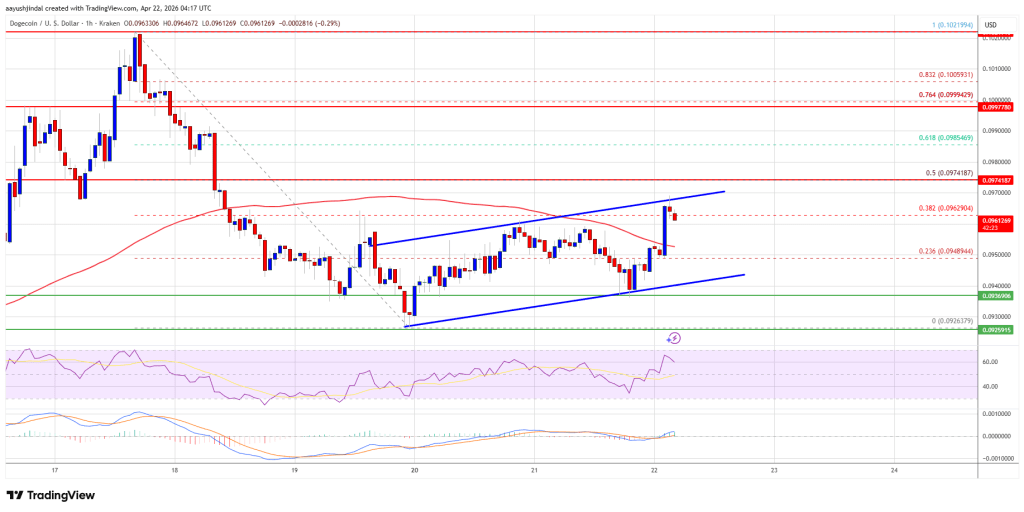
Dogecoin price started a recovery wave from the $0.0925 zone, like Bitcoin and Ethereum. DOGE climbed above the $0.0935 and $0.0942 resistance levels.
There was quite a bit of upside above the 23.6% Fib retracement level from the downward move from the $0.1021 swing high to the $0.0926 low. However, the bears remained active near the $0.0970 zone. Moreover, an ascending channel is forming with resistance at $0.0970 on the hourly chart of the DOGE/USD pair.
The Dogecoin price is now trading above the $0.0950 level and the 100-hourly moving average. If another recovery wave comes, immediate upside resistance will be around the $0.0970 level. The first major resistance for the bulls could be near the $0.0975 level or the 50% Fib retracement level of the downward move from the $0.1021 swing high to the $0.0926 low.
The next major resistance is near the $0.10 level. A close above the USD 0.10 resistance could send the price towards the USD 0.1020 resistance. Any further gains could send the price towards the USD 0.1065 level. The next big stop for the bulls could be $0.1120.
Another drop in DOGE?
If DOGE price fails to rise above the USD 0.0975 level, it could continue to decline. The initial downside support is near the USD 0.0950 level. The next major support is near the $0.0932 level.
The main support is at $0.0925. If there is a downside break below the USD 0.0925 support, the price could fall further. In the mentioned case, the price could slide towards the $0.090 level or even $0.0880 in the short term.
Technical indicators
Hourly MACD – The MACD for DOGE/USD is now losing momentum in the bullish zone.
Hourly RSI (Relative Strength Index) – The RSI for DOGE/USD is now above the 50 level.
Major support levels – $0.0950 and $0.0925.
Major resistance levels – $0.0975 and $0.10.