

Ethereum price started a recovery wave above the $2,300 zone. ETH is now consolidating and could struggle to stay above the USD 2,385 resistance.
- Ethereum started a recovery wave from the $2,250 zone.
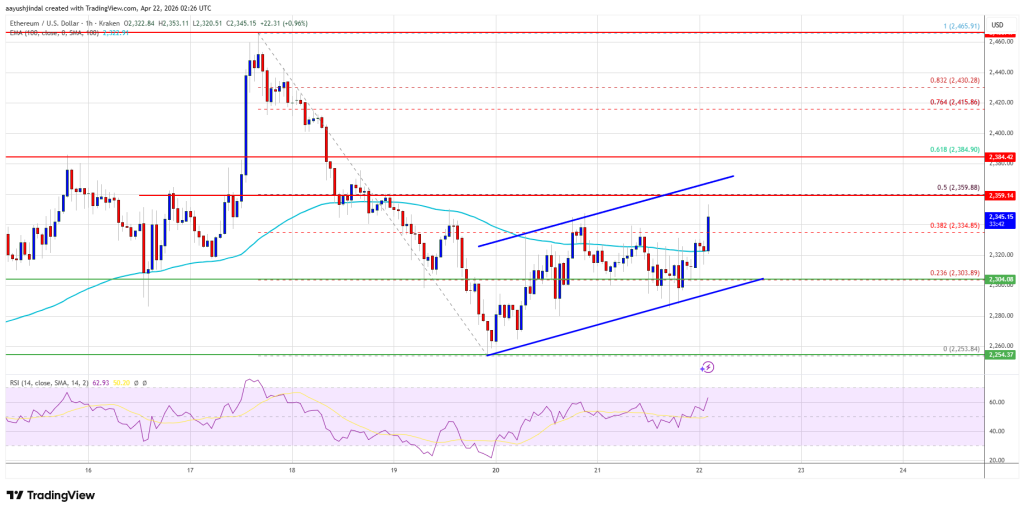
- The price is trading above USD 2,320 and the 100-hourly Simple Moving Average.
- A rising channel is forming with resistance at $2,365 on the hourly chart of ETH/USD (data feed via Kraken).
- The pair could start a new decline if it stays below the $2,385 zone.
Ethereum price faces hurdles
Ethereum price, like Bitcoin, remained above the $2,250 support zone. ETH price formed a base and started a recovery wave above the USD 2,300 resistance.
The price surpassed the 23.6% Fib retracement level of the downward move from the $2,465 swing high to the $2,253 low. The bulls even pushed the price towards $2,350. Additionally, an ascending channel is forming with resistance at $2,365 on the hourly chart of ETH/USD.
Ethereum price is now trading above $2,320 and the 100-hourly Simple Moving Average. If the bulls continue to act above $2,300, the price could rise again. Immediate resistance is seen near the $2,360 level or the 50% Fib retracement level of the downward move from the $2,465 swing high to the $2,253 low.
The first major resistance is around the $2,385 level. The next major resistance is around the $2,400 level. A clear move above the USD 2,400 resistance could send the price towards the USD 2,430 resistance. An upside break above the $2,430 region could lead to more gains in the coming days. In the mentioned case, Ether could rise towards the USD 2,500 or even USD 2,550 resistance zone in the short term.
Another drop in ETH?
If Ethereum fails to clear the USD 2,385 resistance, it could trigger another decline. The initial downside support is near the $2,300 level. The first major support is near the $2,250 zone.
A clear move below the USD 2,250 support could push the price towards the USD 2,200 support. Any further losses could send the price towards $2,150. The main support could be at USD 2,120.
Technical indicators
hourly MACD – The MACD for ETH/USD is gaining strength in the bullish zone.
RSI per hour – The RSI for ETH/USD is now above the 50 zone.
Major support level – $2,300
Major resistance level – $2,385