
 Beats at $88, Bulls Target $100 Rally")
Solana started a new increase above the $85 zone. SOL price is now consolidating around $87 and could aim for more gains above the $90 zone.
- SOL price started a new upward move above the USD 82 and USD 85 levels against the US dollar.
- The price is now trading above $85 and the 100-hour moving average.
- There was a break above a bearish trendline with resistance at $83.60 on the hourly chart of the SOL/USD pair (Kraken data source).
- The pair could extend gains if it breaks the $88 resistance zone.
Solana Price starts a new wave of recovery
Solana price started a decent increase after it crossed above the $82 zone, just like Bitcoin and Ethereum. SOL climbed above the USD 85 level and entered a positive short-term zone.
Earlier, there was a break above a bearish trendline with resistance at $83.60 on the hourly chart of the SOL/USD pair. The price even broke the USD 86 resistance. A high was reached at $86.85, and the price is now consolidating gains above the 23.6% Fib retracement level from the recent upward move from the $81.32 swing low to the $86.85 high.
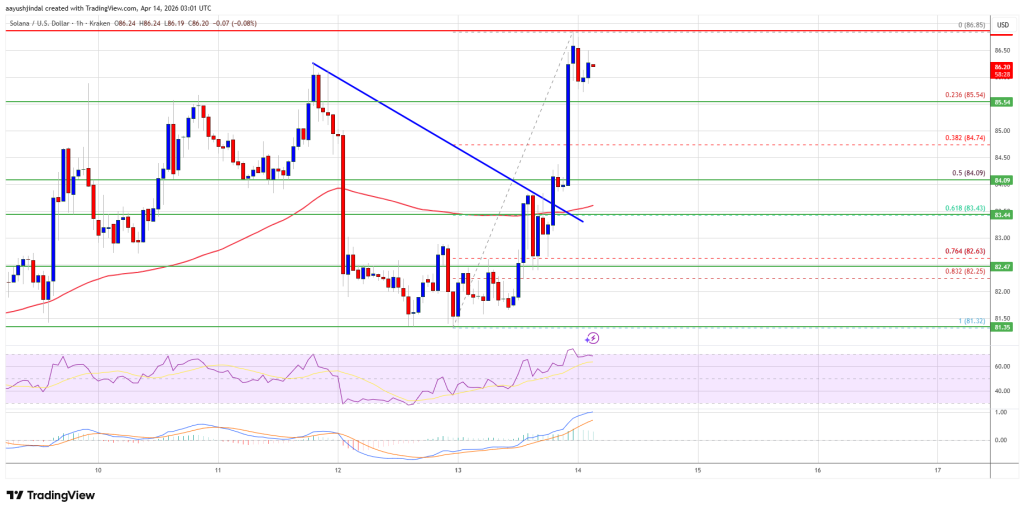
Solana is now trading above $85 and the 100-hour moving average. On the upside, the price is facing resistance near USD 86.80. The next major resistance is around the $88 level. The main resistance could be at $92. A successful close above the $92 resistance zone could set the pace for another steady rise. The next major resistance is $100. Any further gains could send the price towards the USD 102 level.
Downward correction in SOL?
If SOL fails to rise above the USD 88 resistance, it could trigger another decline. The initial downside support is near the $85.50 zone. The first major support is near the $84.00 level and the 50% Fib retracement level of the recent upward move from the $81.32 swing low to the $86.85 high.
A break below the USD 84.00 level could send the price towards the USD 82 support zone. If there is a close below the USD 82 support, the price could fall towards the USD 76.50 support in the near term.
Technical indicators
Hourly MACD – The MACD for SOL/USD is gaining speed in the bullish zone.
Hourly RSI (Relative Strength Index) – The RSI for SOL/USD is above the 50 level.
Major support levels – USD 85.50 and USD 84.00
Major resistance levels – $88.00 and $90.00.