

Bitcoin price is struggling to break above $113,500 and $114,000. BTC is now consolidating and could start a new decline below $110,000.
- Bitcoin started a new decline after failing to break the $114,000 resistance level.
- The price is trading below $113,000 and the 100 hourly Simple Moving Average.
- A bearish trendline is forming with resistance at $112,000 on the hourly chart of the BTC/USD pair (data feed from Kraken).
- The pair could continue to decline if it trades below the $110,200 zone.
Bitcoin price faces hurdles
Bitcoin price started a recovery wave above the USD 112,500 resistance level. BTC recovered above the USD 112,800 and USD 113,000 resistance levels.
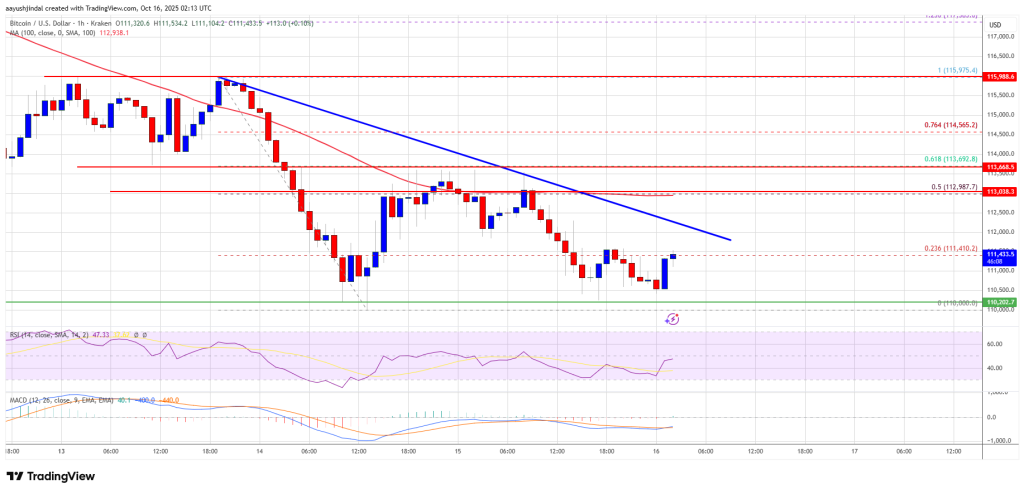
The price climbed above the 50% Fib retracement level of the recent decline from the $115,975 swing high to the $110,000 low. The bulls even pushed the price above the USD 113,500 resistance level. However, there are many obstacles on the positive side.
Bitcoin is now trading below $113,000 and the 100 hourly Simple Moving Average. Moreover, a bearish trendline is forming with resistance at $112,000 on the hourly chart of the BTC/USD pair.
The immediate resistance on the upside is near the USD 112,000 level. The first major resistance is around the $113,000 level. The next resistance could be $113,700 and the 61.8% Fib retracement level from the recent decline from the $115,975 swing high to the $110,000 low.
A close above the resistance at $113,700 could send the price higher. In the mentioned case, the price could rise and test the USD 114,500 resistance. Any further gains could send the price towards the USD 115,250 level. The next threshold for the bulls could be $115,500.
Another drop in BTC?
If Bitcoin fails to rise above the USD 113,000 resistance zone, it could start a new decline. Immediate support is near the $110,200 level. The first major support is near the $110,000 level.
The next support is now near the $109,500 zone. Any further losses could send the price towards the USD 108,500 support in the short term. The key support is at $107,200, below which BTC could struggle to recover in the near term.
Technical indicators:
Hourly MACD – The MACD is now gaining speed in the bearish zone.
Hourly RSI (Relative Strength Index) – The RSI for BTC/USD is now below the 50 level.
Major support levels – USD 110,200, followed by USD 110,000.
Major resistance levels – $112,000 and $113,000.