

The Bitcoin price extended its rise above $66,000. BTC is now correcting gains below $65,500 and could continue to decline towards $64,000.
- Bitcoin corrects gains from the $66,500 zone.
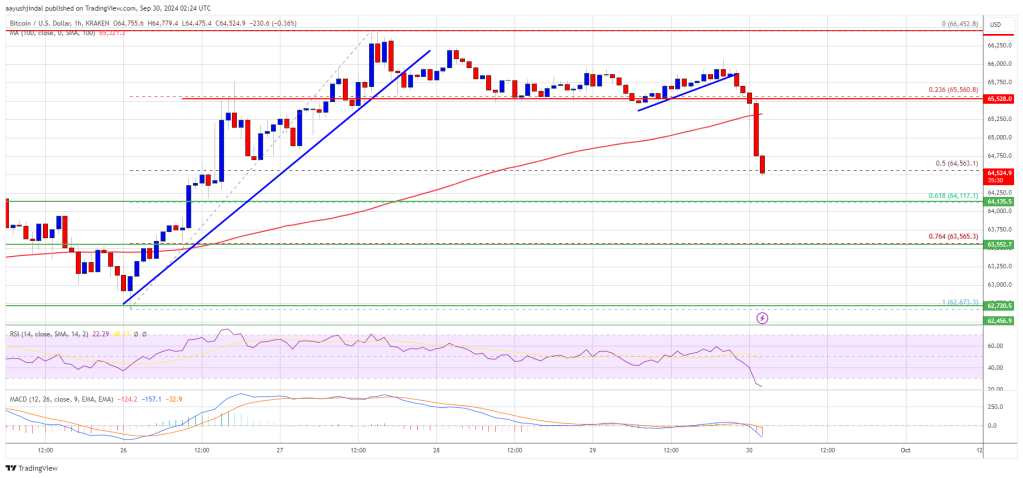
- The price is trading below $65,250 and the 100 hourly Simple Moving Average.
- There was a break below a short-term bullish trendline with support at $65,750 on the hourly chart of the BTC/USD pair (data feed from Kraken).
- The pair could start to rise again if it remains above the $64,000 support zone.
Bitcoin Price Begins Downward Correction
Bitcoin price remained supported around the USD 63,250 level. BTC extended its rise above the USD 65,500 resistance zone. It even reached the $66,000 level.
It reached a high at $66,452 and the price is now correcting gains. There was a decline below the $66,000 level. The price fell below the 23.6% Fib retracement level of the upward move from the $62,672 swing low to the $66,452 high.
There was a break below a short-term bullish trendline with support at $65,750 on the hourly chart of the BTC/USD pair. Bitcoin is now trading below $65,500 and the 100 hourly Simple Moving Average.
The bulls are now trying to protect the $64,500 zone. If a new increase occurs, the price may encounter resistance near the USD 65,250 level. The first major resistance is around the $65,500 level. A clear move above the USD 65,500 resistance could push the price higher.
The next major resistance could be at USD 66,500. A close above the $66,500 resistance could provide more upside. In the said case, the price could rise and test the USD 68,000 resistance level.
Lose more in BTC?
If Bitcoin fails to rise above the $65,500 resistance zone, the price may continue to decline. The immediate downside support is near the $64,200 level and the 61.8% Fib retracement level of the upward move from the $62,672 swing low to the $66,452 high.
The first major support is near the $64,000 level. The next support is now near the $63,500 zone. Any further losses could send the price towards the USD 62,650 support in the near term.
Technical indicators:
Hourly MACD – The MACD is now gaining speed in the bearish zone.
Hourly RSI (Relative Strength Index) – The RSI for BTC/USD is now below the 50 level.
Major support levels – USD 64,200, followed by USD 64,000.
Major resistance levels – $65,250 and $65,500.