

Bitcoin’s price failed to break above $31,800 and corrected most of its gains. BTC is now attempting another increase from the $29,950 support zone.
- Bitcoin consolidates losses above the $30,000 support zone.
- The price is trading below $30,500 and the 100 simple hourly moving average.
- A major bearish trendline is forming with resistance near USD 30,320 on the hourly chart of the BTC/USD pair (data feed from Kraken).
- The pair could gain bullish momentum if there is a close above $30,400.
Bitcoin Price Has Major Support
Bitcoin price surged above the USD 31,400 resistance, but there was no follow-up action. BTC struggled to clear the USD 31,800 level and it stayed below USD 32,000.
A high was formed near USD 31,790 before a sharp decline. There was movement below the $31,000 and $30,400 levels. The price even spiked below $30,000. A low is formed near $29,950 and the price is now consolidating losses.
Bitcoin is now trading below $30,500 and the 100 simple hourly moving average. A major bearish trendline is also forming with resistance near USD 30,320 on the hourly chart of the BTC/USD pair.
Immediate resistance is near the $30,300 level and trendline. The first major resistance is near USD 30,400. It is near the 23.6% Fib retracement level of the downward move from the $31,790 swing high to the $29,950 low, above which the price could gain bullish momentum.
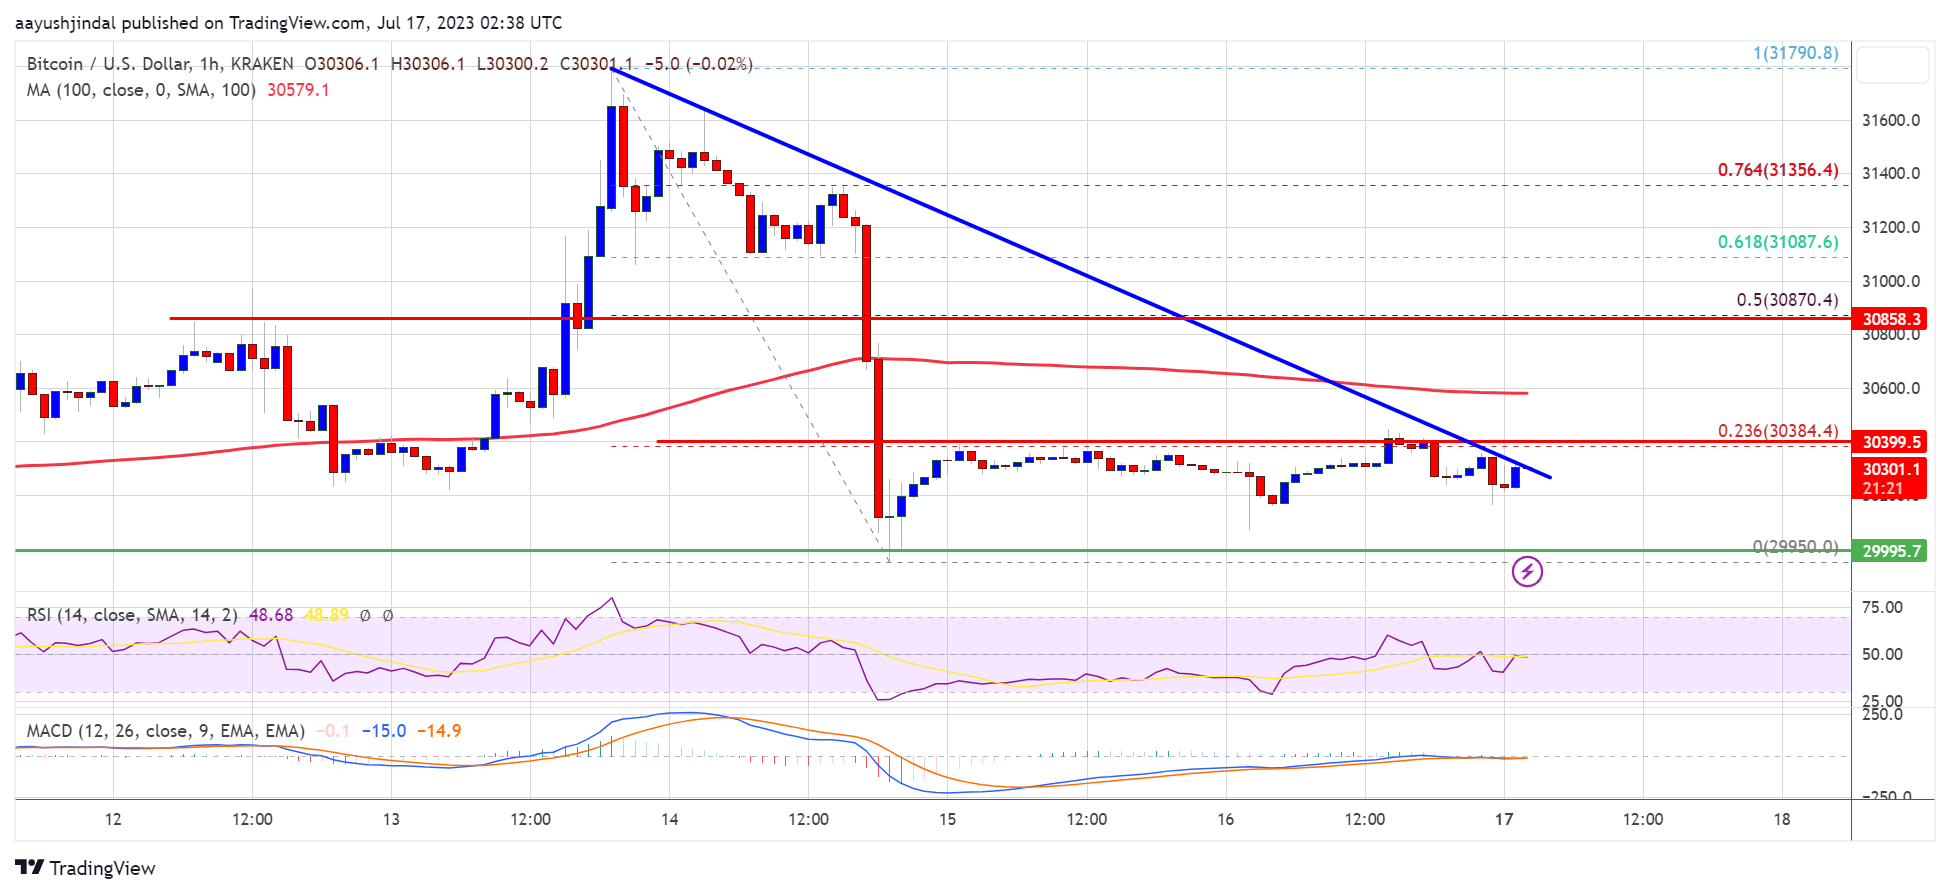
Source: BTCUSD at TradingView.com
In the said case, BTC could rise towards the USD 30,850 resistance. It is close to the 50% Fib retracement level of the downward move from the $31,790 swing high to the $29,950 low. The next major resistance is near the USD 31,150 level. Any further gains could open the door for a move towards the $31.80 resistance zone.
Lose more in BTC?
If Bitcoin fails to clear the USD 30,380 resistance, it could start a downside correction. Immediate support on the downside is near the $30,200 level.
The next major support is near the $30,000 level, below which there could be a drop towards the $29,750 support zone. Any more losses could send the price towards the $29,350 level in the near term.
Technical indicators:
Hourly MACD – The MACD is now losing pace in the bearish zone.
Hourly RSI (Relative Strength Index) – The RSI for BTC/USD is now near the 50 level.
Major Support Levels – $30,200, followed by $30,000.
Major resistance levels – $30,380, $30,850 and $31,150.