

MemeCore [M] suffered a decisive slump after sellers surpassed a key support level, pushing the token below its long-standing trading range. At the time of writing it is MemeCore was trading at $0.6002 after falling 10.77% on the day, while its market cap fell 12.98% to $785.92 million.
Trading activity moved in the opposite direction as 24-hour volume rose 30.02% to $15.85 million, showing that participants were actively reacting to the sharp decline. The sell-off also wiped out support at $1.25, a level that had previously attracted buyers.
As a result, the market structure weakened significantly, leaving traders wondering whether the recent decline marked a capitulation or the start of a new bearish leg.
Stock market flows indicate declining activity on the sell side
AC data showed a different picture despite the aggressive price decline.
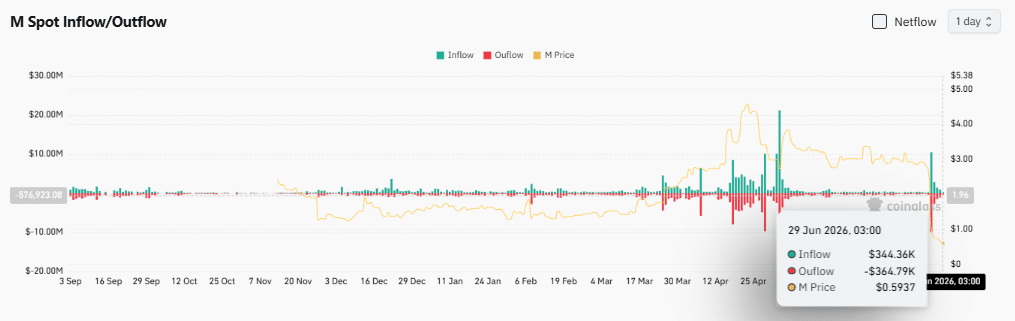
Inflows totaled $344.36K, while outflows reached $364.79K, leaving a negative net flow of approximately $20.43K. While the difference remained small, the figures showed that more tokens left exchanges than entered during the observed period.
That pattern suggested some holders still preferred to move assets into private portfolios rather than position them for immediate sales. However, the limited size of the outflow indicated that buyers had not yet returned with enough conviction to reverse sentiment.
The price therefore continued to reflect broader weakness despite the slight reduction in held supply.
MemeCore crashed below support as RSI reached extremes
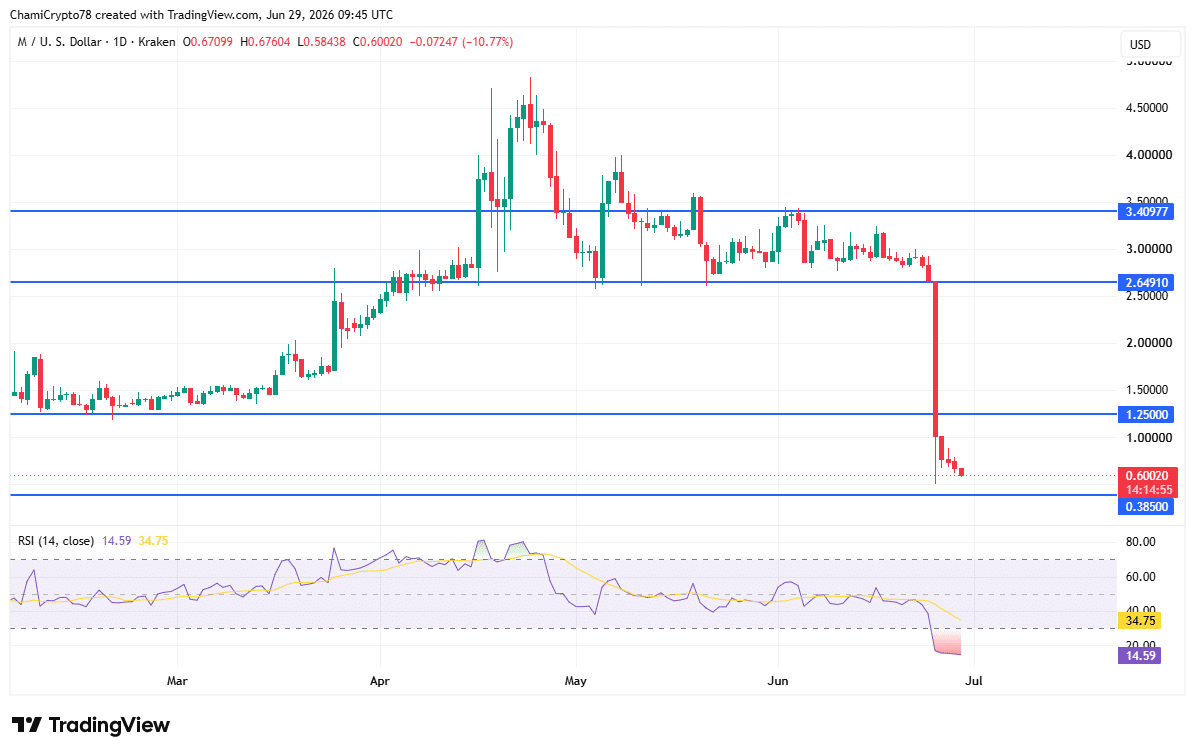
Price action confirmed that sellers had taken full control after MemeCore broke the critical support at $1.25 without significant resistance. The breakdown quickly pushed the token towards the $0.60 region, a multi-month low, leaving previous support well above the current market price.
Meanwhile, the Relative Strength Index fell to 14.59 at the time of writing, pushing the asset deep into oversold territory after continued selling pressure. Such measurements often reflected exhaustion among sellers, but did not guarantee an immediate reversal.
Instead, the chart showed bearish control remaining intact as buyers looked for signs of stabilization. For any recovery, M would first have to regain lost support before a broader trend shift could become more credible.
Where is the liquidation pressure concentrated now?
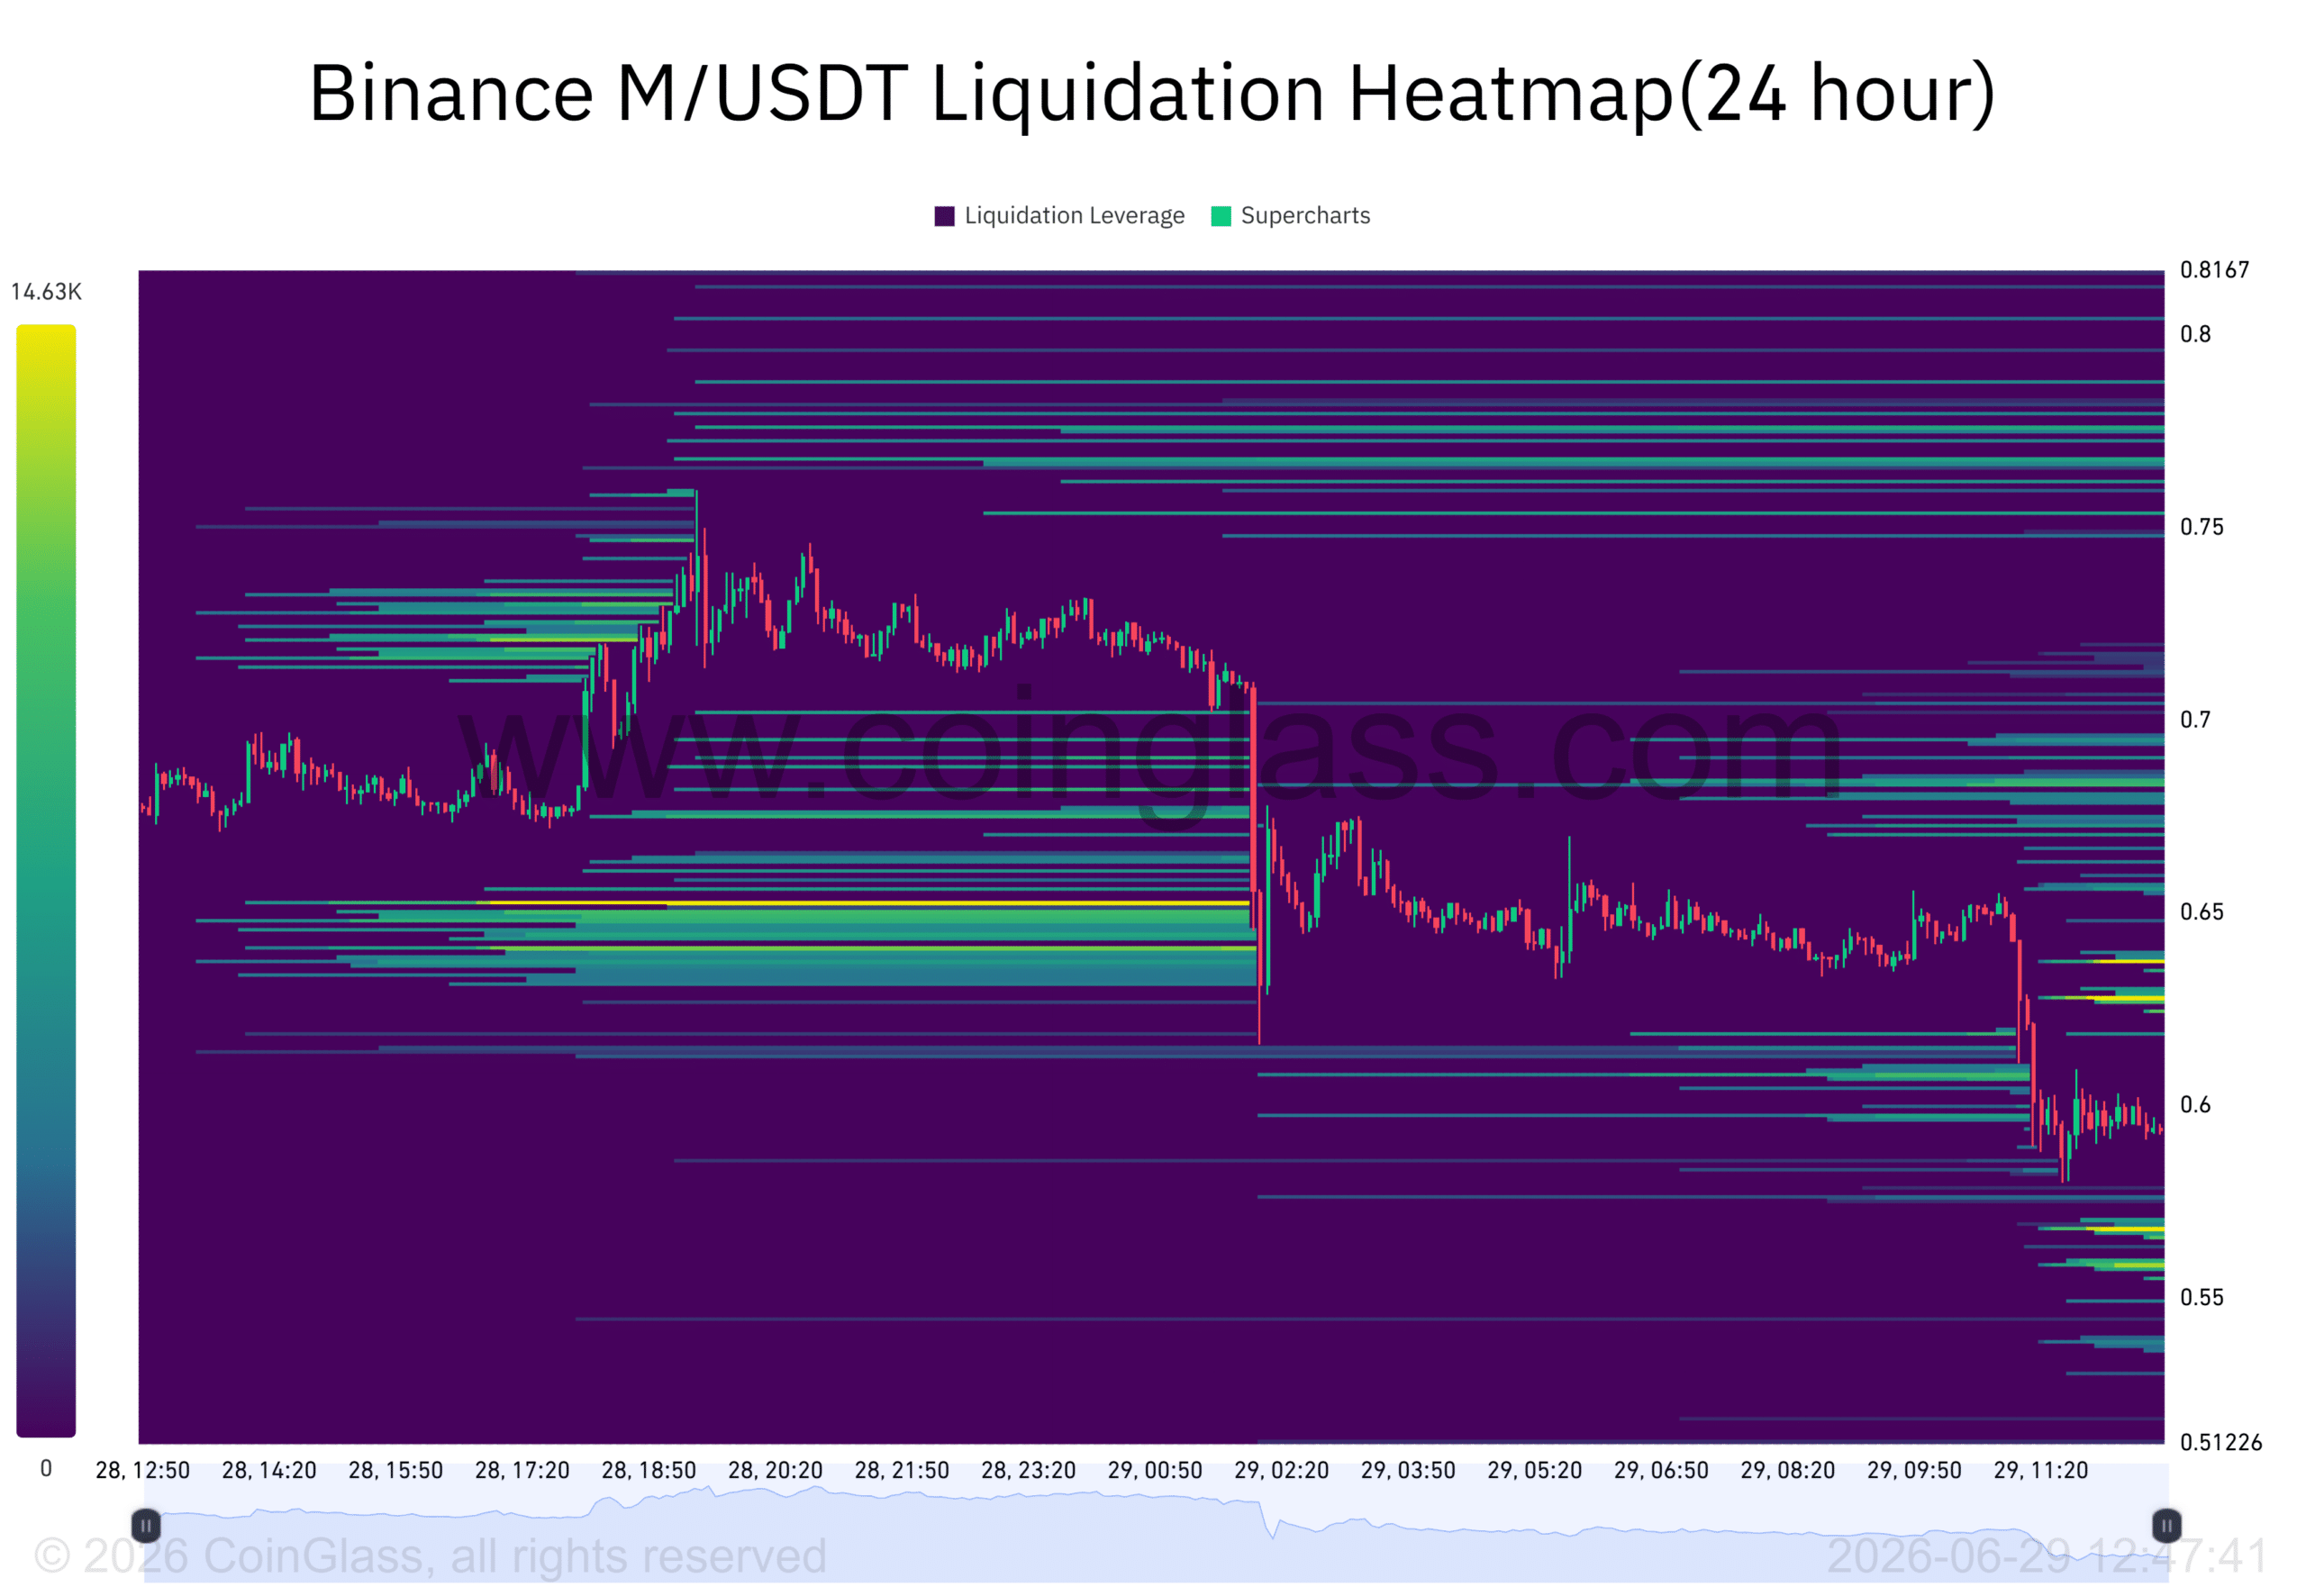
The liquidation heatmap showed that the largest concentration of leveraged positions formed between $0.64 and $0.66 after the last drop. These clusters represented the first meaningful resistance zone as buyers attempted to recover from current levels.
Outside that area, liquidity weakened noticeably to higher price levels, indicating that a sustained recovery will require strong buying activity to absorb overhead supply. On the other hand, liquidation pockets remained spread out below the current price, rather than forming one dominant target.
As a result, the heatmap suggested that traders would likely focus first on whether M could regain the nearby liquidity margin before considering a broader recovery.
Can MemeCore regain stability?
MemeCore remained under heavy bearish pressure after losing a major support level and entering deep oversold territory. Although the negative net flows in the spot market indicated that selling pressure in the foreign exchange markets had subsided somewhat, the price structure still favored sellers.
A recovery could develop if buyers regain the liquidation zone of $0.64 to $0.66 and establish support above. Otherwise, continued weakness would likely keep M trading near the current low as participants look for the next reliable demand zone.
Final summary
- MemeCore lost a major support level, while the RSI fell into deep oversold territory.
- Negative net flows in the spot market continued even as liquidation resistance formed around the $0.64-$0.66 zone.