

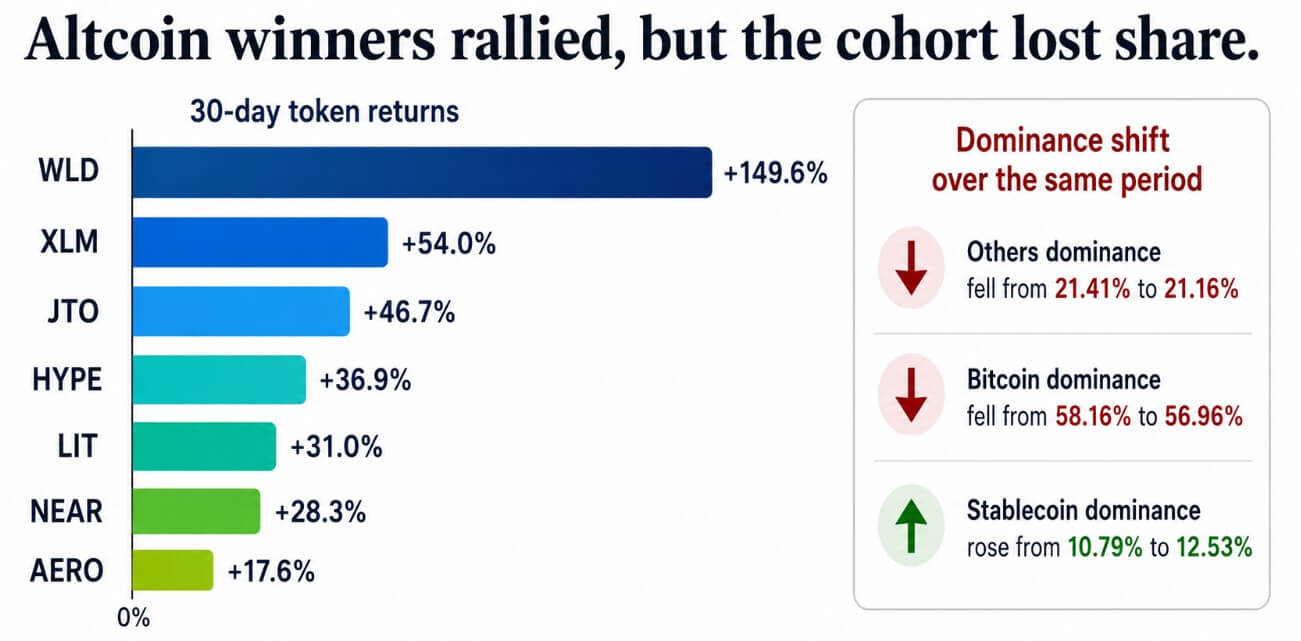
The WLD token rose 149.6% over the past month, XLM climbed 54%, JTO gained 46.7%, and HYPE set a new all-time high of $77 on June 16. Still, the market dominance of the altcoin cohort excluding Bitcoin, Ethereum, and stablecoins fell from 21.41% to 21.16% over the same period. 23.55% at the beginning of the year, according to CoinGecko data.
Other altcoin gains in the past 30 days include NEAR up 28.3%, LIT up 31%, and AERO up 17.6%. In seven days, the leaderboard expanded further, with JTO adding 42.5%, AERO 36.8%, WLD 33%, and UNI, XLM, AAVE, JUP, and ENA all posting double-digit gains.
The drop in “others” was accompanied by a drop in Bitcoin dominance, from 58.16% to 56.96%, and stablecoin dominance rose from 10.79% to 12.53% to absorb that vacated share.
The sales that are not reflected in the prices
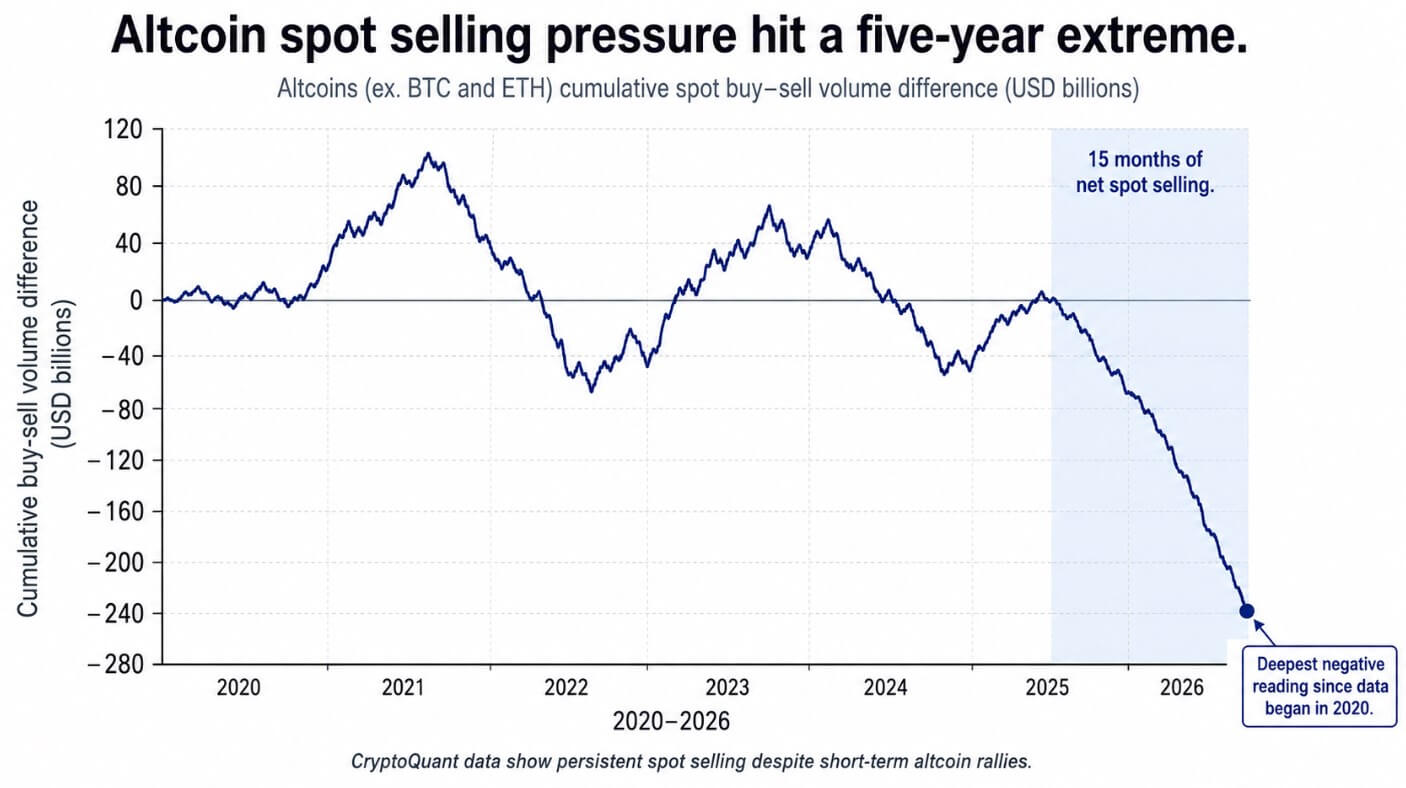
Data from CryptoQuant shows that altcoins have recorded 15 consecutive months of net spot selling, with a cumulative buy-to-sell ratio. volume difference of $240 billionthe deepest negative reading since the data series began in 2020.
The indicator recovered almost to neutral in early 2025, but then deteriorated again in the first half of 2026 as spot sellers absorbed any rally the rankings generated.
Each winning token had a specific catalyst that explains the difference from the cohort performance.
WLD traded as an AI and OpenAI proxy after Eightco Holdings disclosed this over 283 million WLD In addition to the indirect exposure to OpenAI in its treasury, traders were pricing a concentrated ‘Worldcoin plus OpenAI-adjacent’ narrative.
XLM’s move followed the tokenized real asset growth on Stellar as RWA.xyz shows approximately $2.83 billion in distributed asset value on the network, up 21.62% over 30 days, which is boosted by the cooperation with the DTCC.
JTO’s breakthrough came with 24-hour volume of $371.2 million and an intraday gain of 31.3%, driven by momentum from the Solana infrastructure and the announcement of the JTX, Jito’s trading interface.
AERO followed Base’s momentum and a 266% increase in derivatives volume to $46.25 million, which was then partially offset by profit-taking.
HYPE’s all-time high on June 16 of $77 peaked at nearly $1 billion in 24-hour trading volume and real protocol support. DeFiLlama data shows that Hyperliquid has multi-trillion cumulative perpetual volume and over $9 billion in open interest, and the dominance of ‘others’ remains at the bottom anyway.
What would change things?
The bearish case is that the current setup is a distribution pattern, with select tokens providing exit liquidity amid persistent spot selling, while dominance of ‘others’ drifts towards 20.5% and stablecoin stock tests 14%-15%.
The macroeconomic backdrop supports this thesis, as nearly half of Fed policymakers now see a possible rate hike in 2026, keeping the policy rate at 3.50%-3.75% and revising inflation forecasts upward.
AI and semiconductor assets pulled capital away from high-beta crypto, with major semiconductor ETFs absorbing heavy inflows while Bitcoin ETFs recorded outflows in early June.
| Scenario | Others dominance | dominance of stable coins | CryptoQuant signal | Interpretation |
|---|---|---|---|---|
| Bear case | Drift towards 20.5% | Testing 14%–15% | The selling pressure is increasing | Selective rallies become exit liquidity |
| Basic case | Holds almost 21%–22% | Remains elevated | The cumulative gap remains deeply negative | Narrow leaderboard rally, no alternate season |
| Taurus case | Claims 22.5% then 23.55% YTD level | Rolls over | The buying-selling gap has been improving for several weeks | The rotation widens to a real altcoin bid |
The bull case requires ‘others’ dominance to regain 22.5% and return to year-to-date levels of 23.55%, stablecoin dominance to roll over, and CryptoQuant’s cumulative gap to improve for several consecutive weeks.
WLD’s Eightco catalyst, HYPE’s protocol revenue, JTO’s Solana infrastructure story, XLM’s RWA expansion, and AERO’s Base liquidity position all gave traders specific reasons to trade on specific tokens. The dominance data, the spot sales figures and the 90-day breadth index together show that the cohort does not yet have a reason of its own.