

After falling more than 2% over the past day, Bitcoin [BTC] was trading at $61,336.93 at the time of writing, inching closer to the $60,000 mark.
That said, BTC fell more than 24% over the past month, from $82,000 in mid-May to $61,000 at the time of publication.
The crypto community is divided
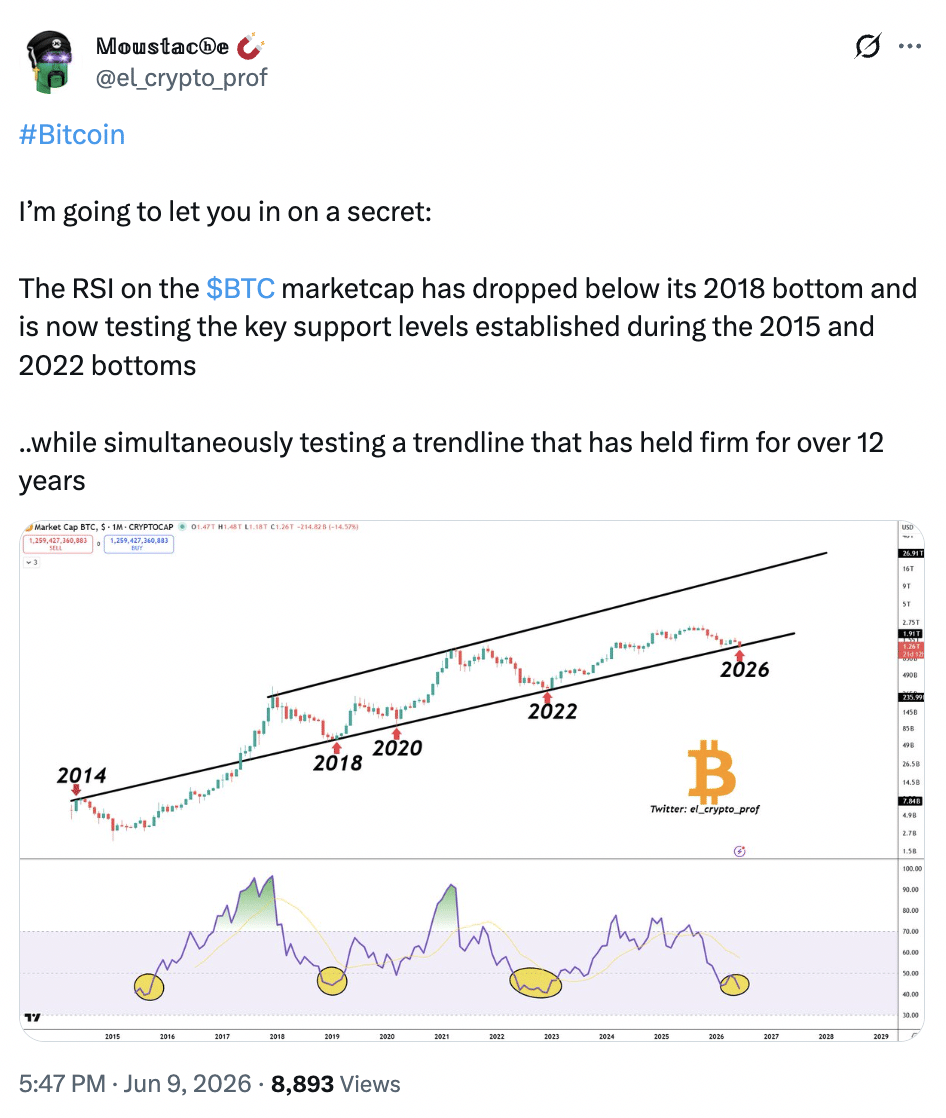
Given this significant drop, there appears to be disagreement within the crypto community. For example, one analyst highlighted that the RSI for the Bitcoin market cap has fallen below its 2018 low.
He said,
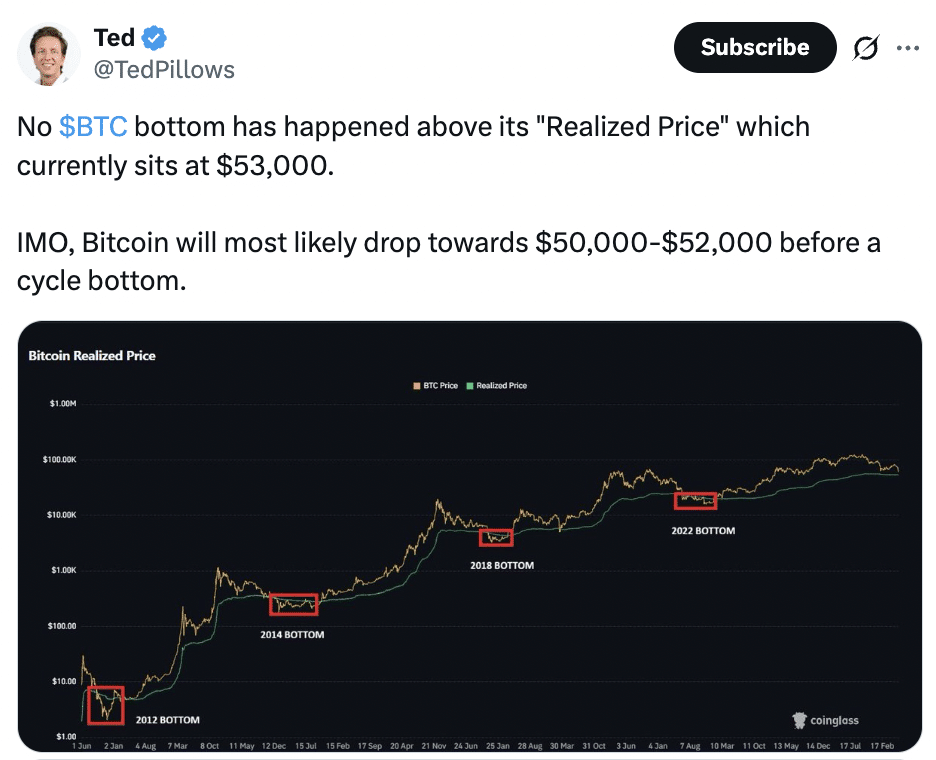
However, another analyst saw the exact opposite trend, noting:
Interestingly, Wintermute, an algorithmic trading company, claimed that there are no clear indications that capital returns. They further raised the flag that the bottom of the market has not yet been verified.
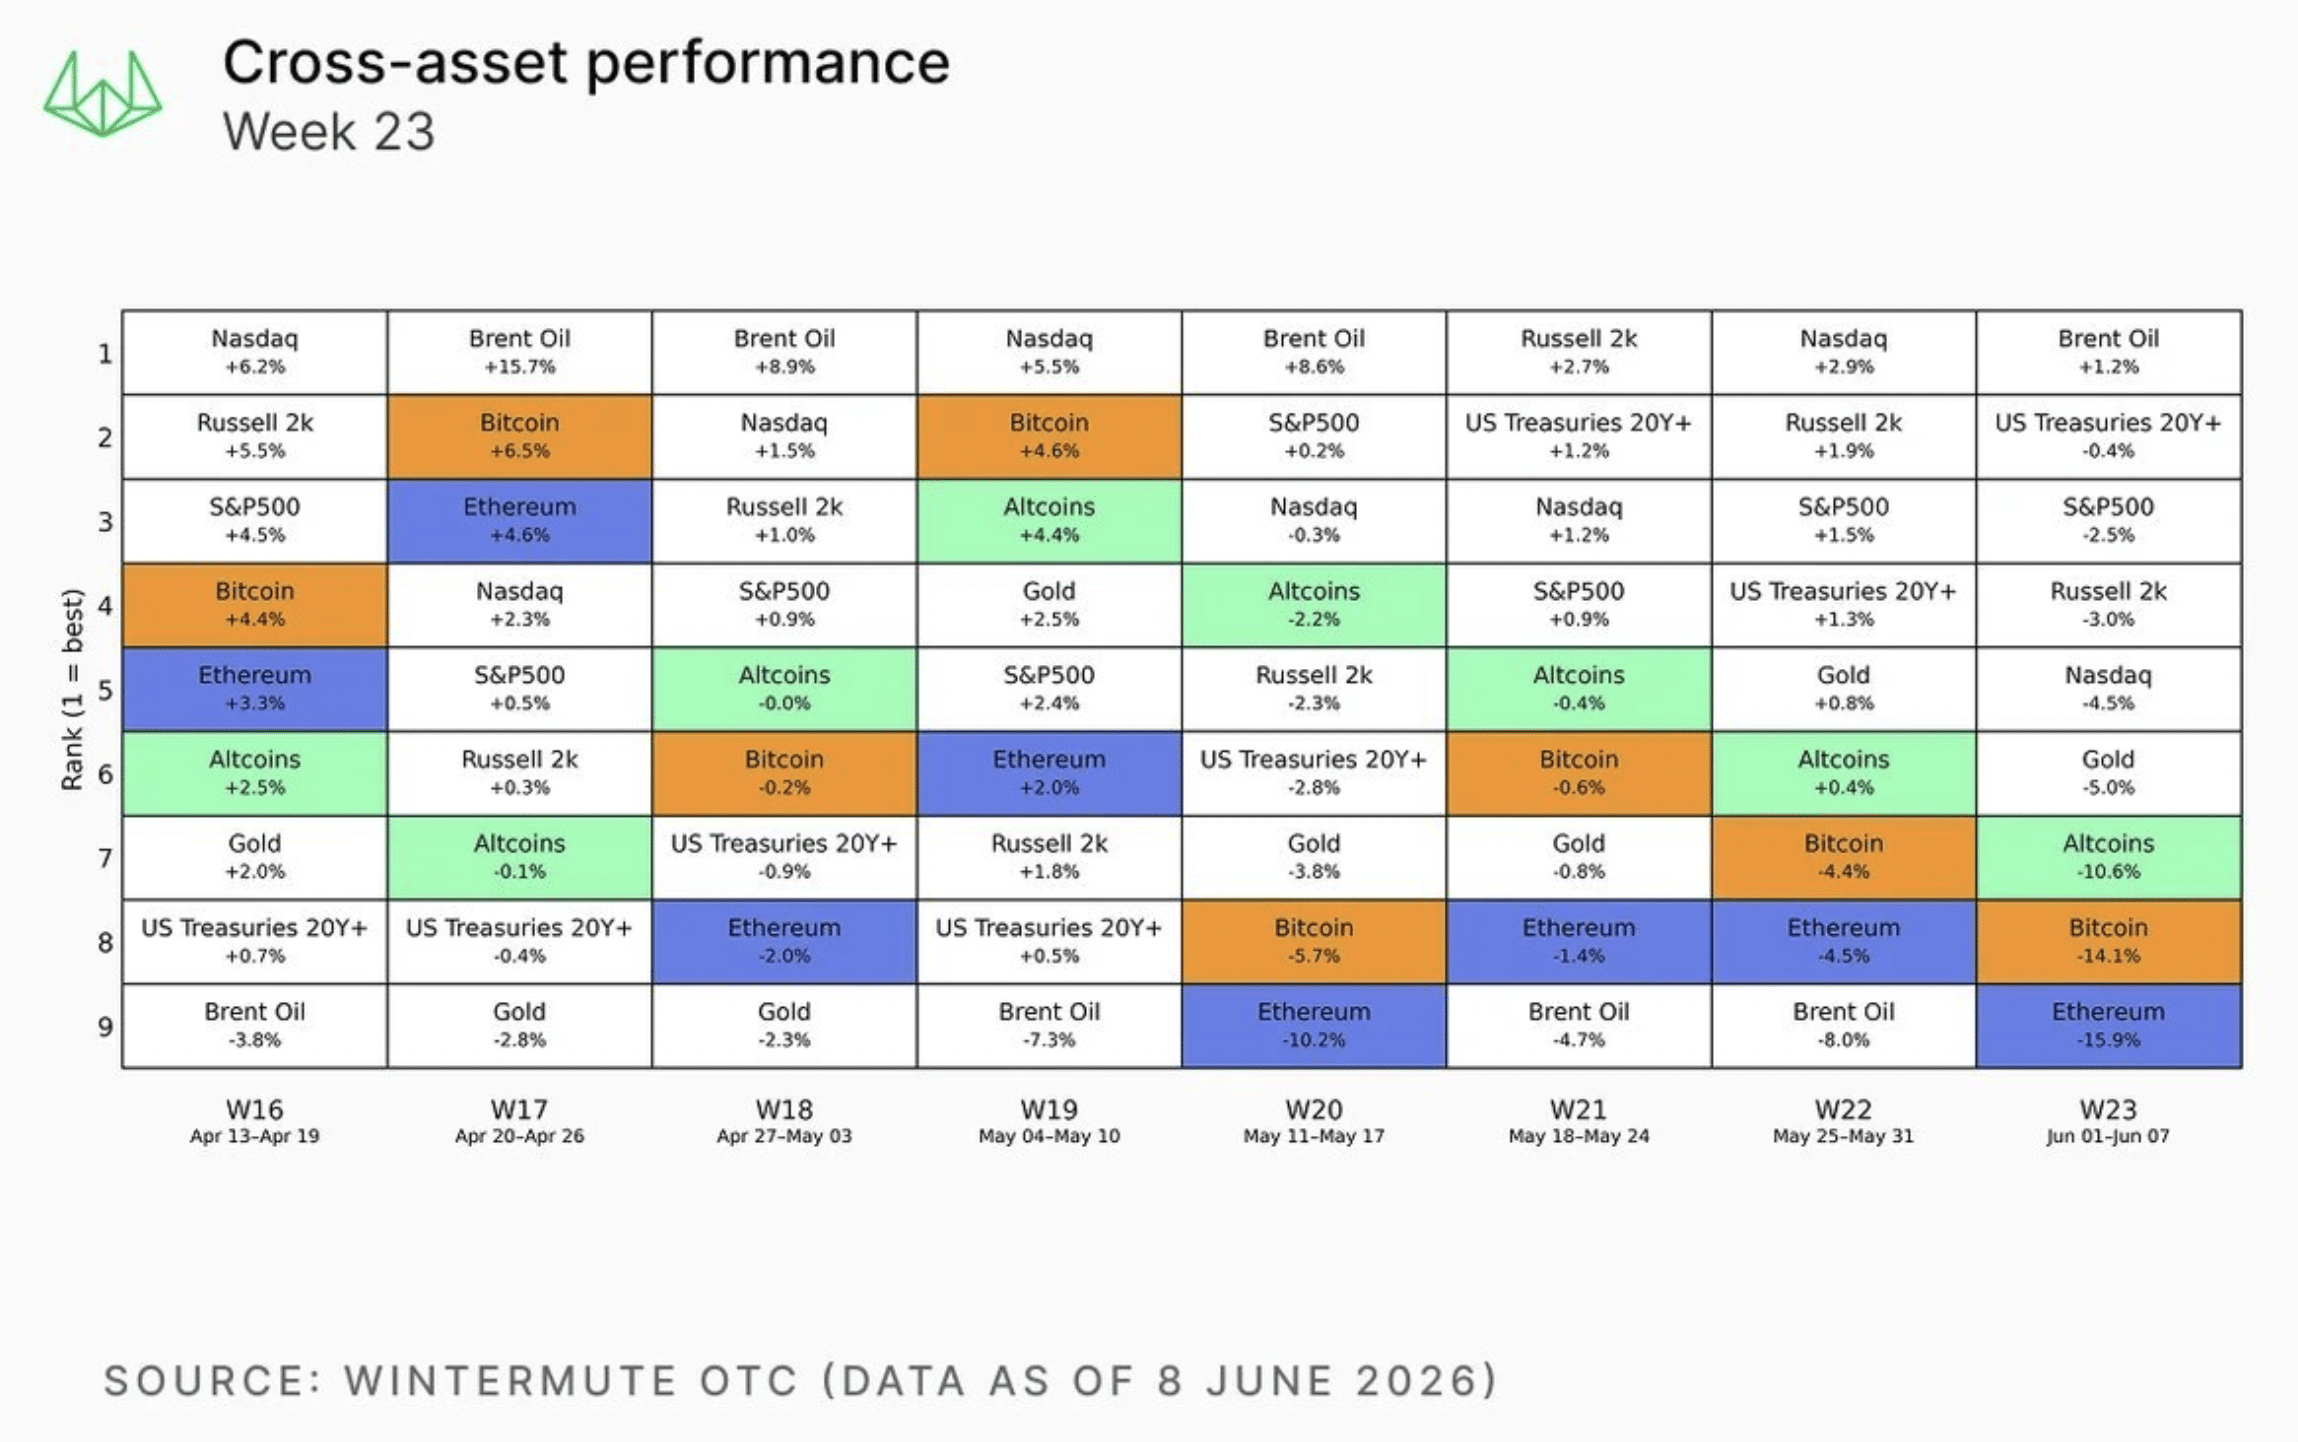
According to Wintermute, institutional selling and ETF withdrawals in the US were the main drivers of Bitcoin’s recent decline.
Where is Bitcoin’s future trajectory trending?
To determine where Bitcoin is really trending, CryptQuant’s Bitcoin Supply in Loss, a 7-day moving average, is the perfect on-chain metric.
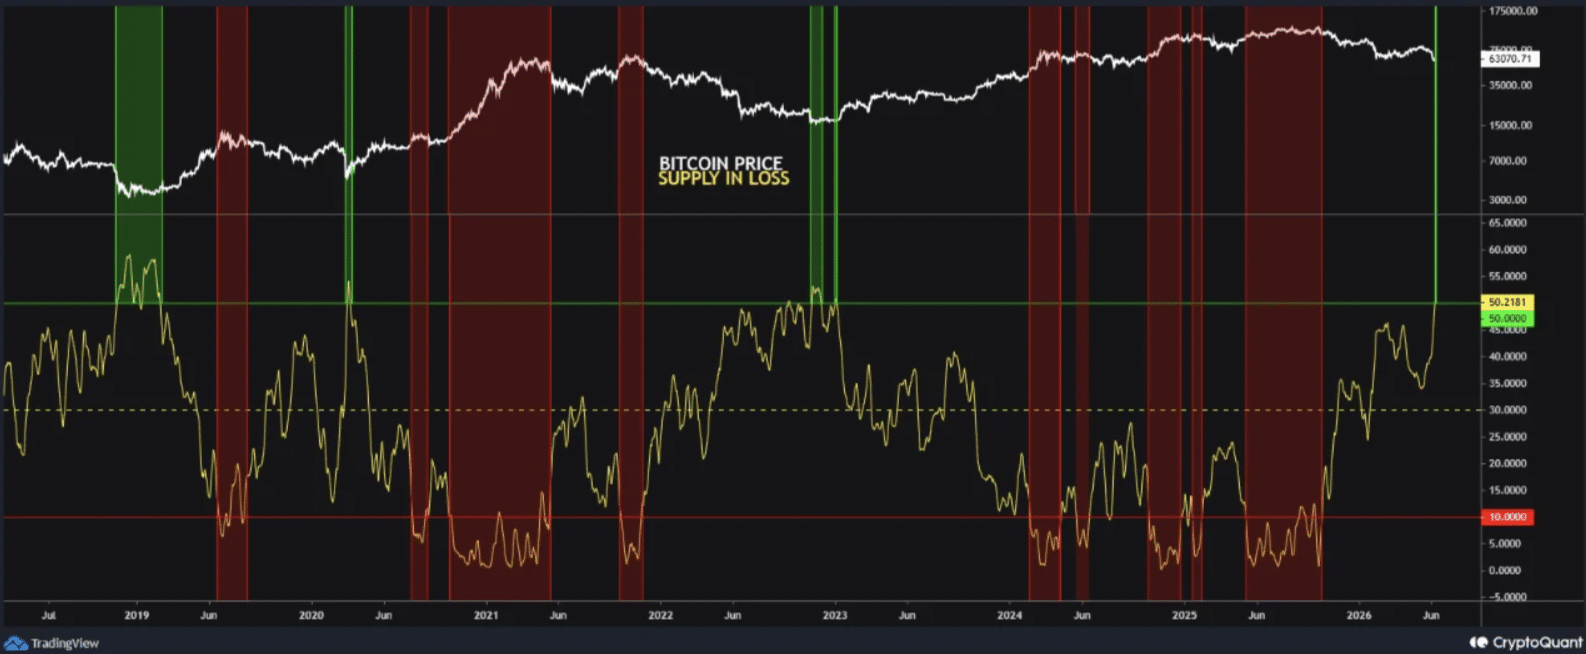
According to the analysis, the indicator has risen above 50%. This indicates that, depending on the price at which these coins last moved, more than half of the circulating supply of BTC is currently held at a loss.
Such levels historically correspond to times of extreme market pessimism and surrender.
In such scenarios, investors are more likely to sell out of fear after prolonged price declines. This indicator last crossed the 50% mark in November 2022, when Bitcoin was trading below $20,000 after the FTX collapse.
Furthermore, Glassnode’s profit and loss chart indicated that at the cycle peak, almost half of the total supply was profitable.
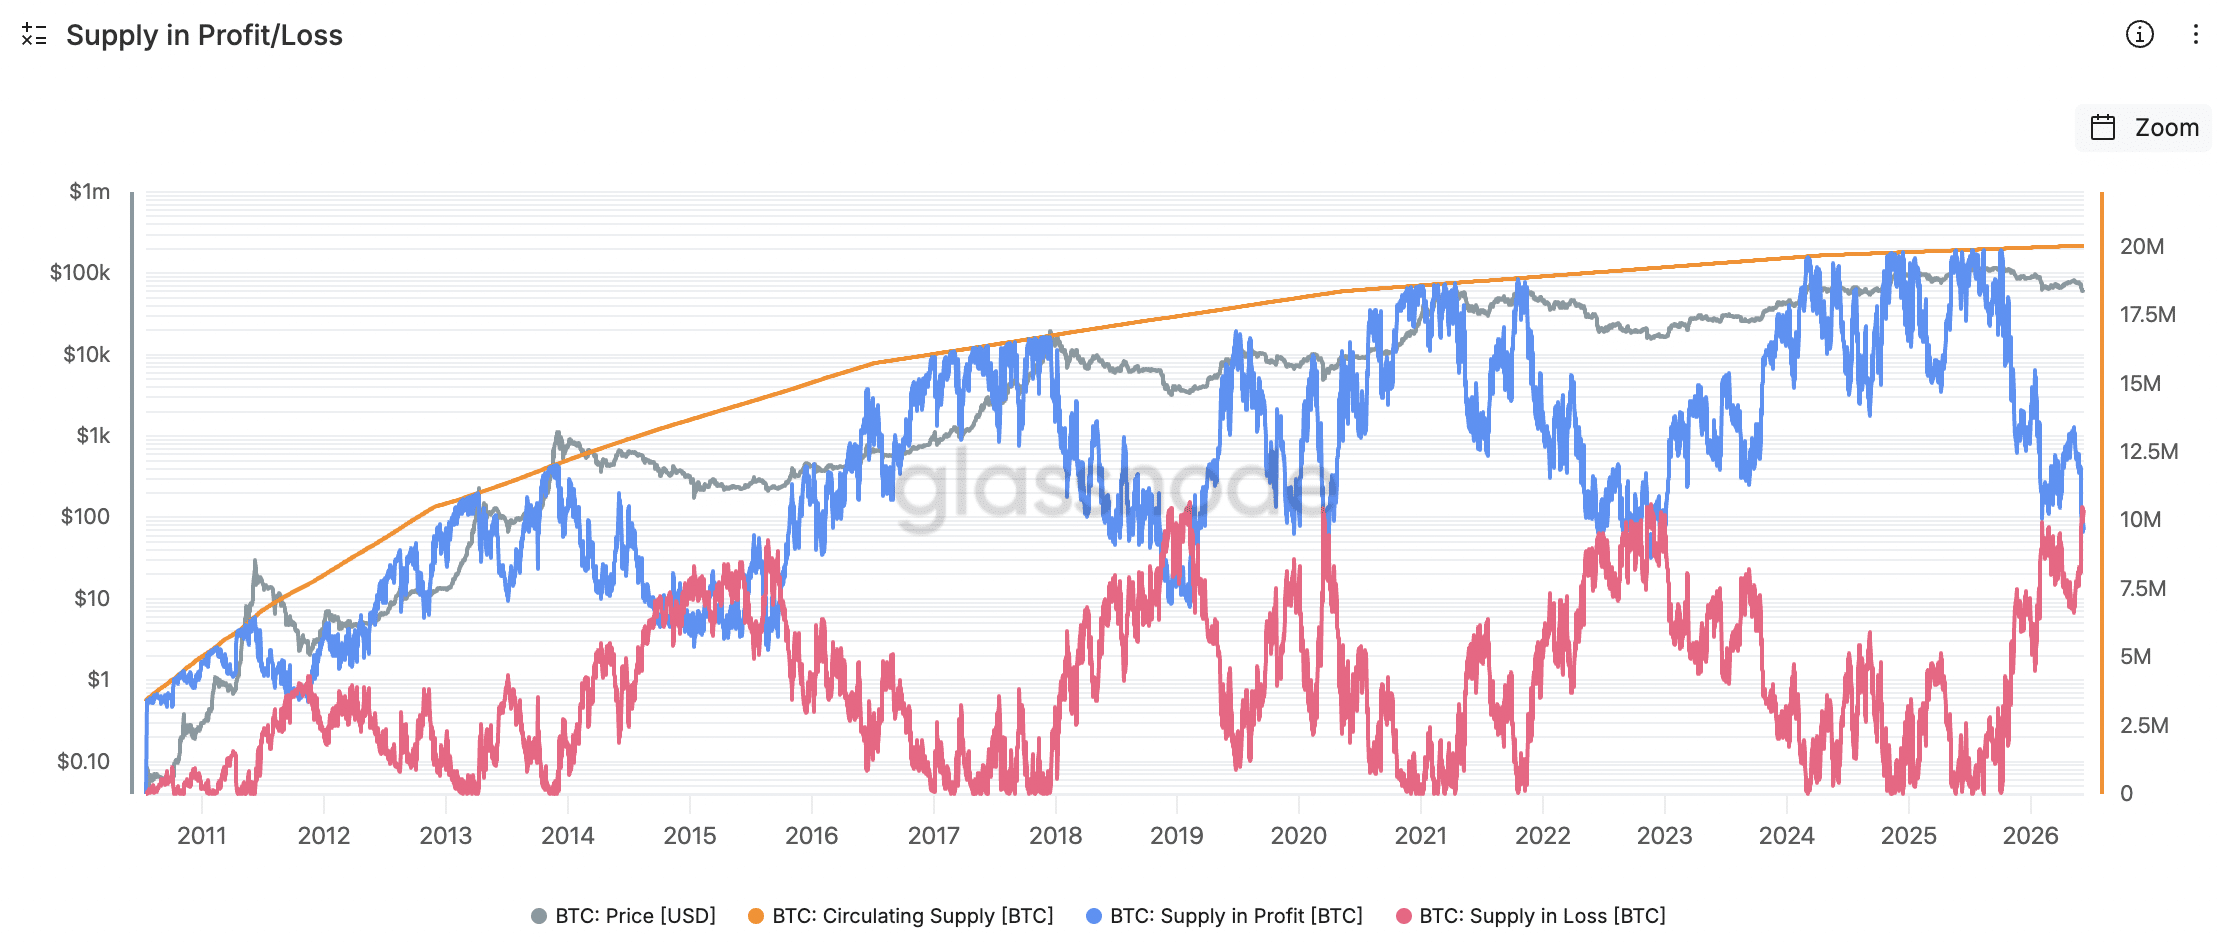
With more than 8 million Bitcoins currently underwater, that number has dropped dramatically, underscoring the magnitude of the most recent market reset.
Is Bitcoin Nearing Stabilization or Volatility Increasing?
Moreover, AMBCrypto also stated that the bulls have further failed to raise the price. However, Swissblock’s Risk Index and Bitcoin ETF flow data indicate that market conditions have shifted toward a higher-risk environment, which is necessary to determine whether Bitcoin is truly stabilizing.
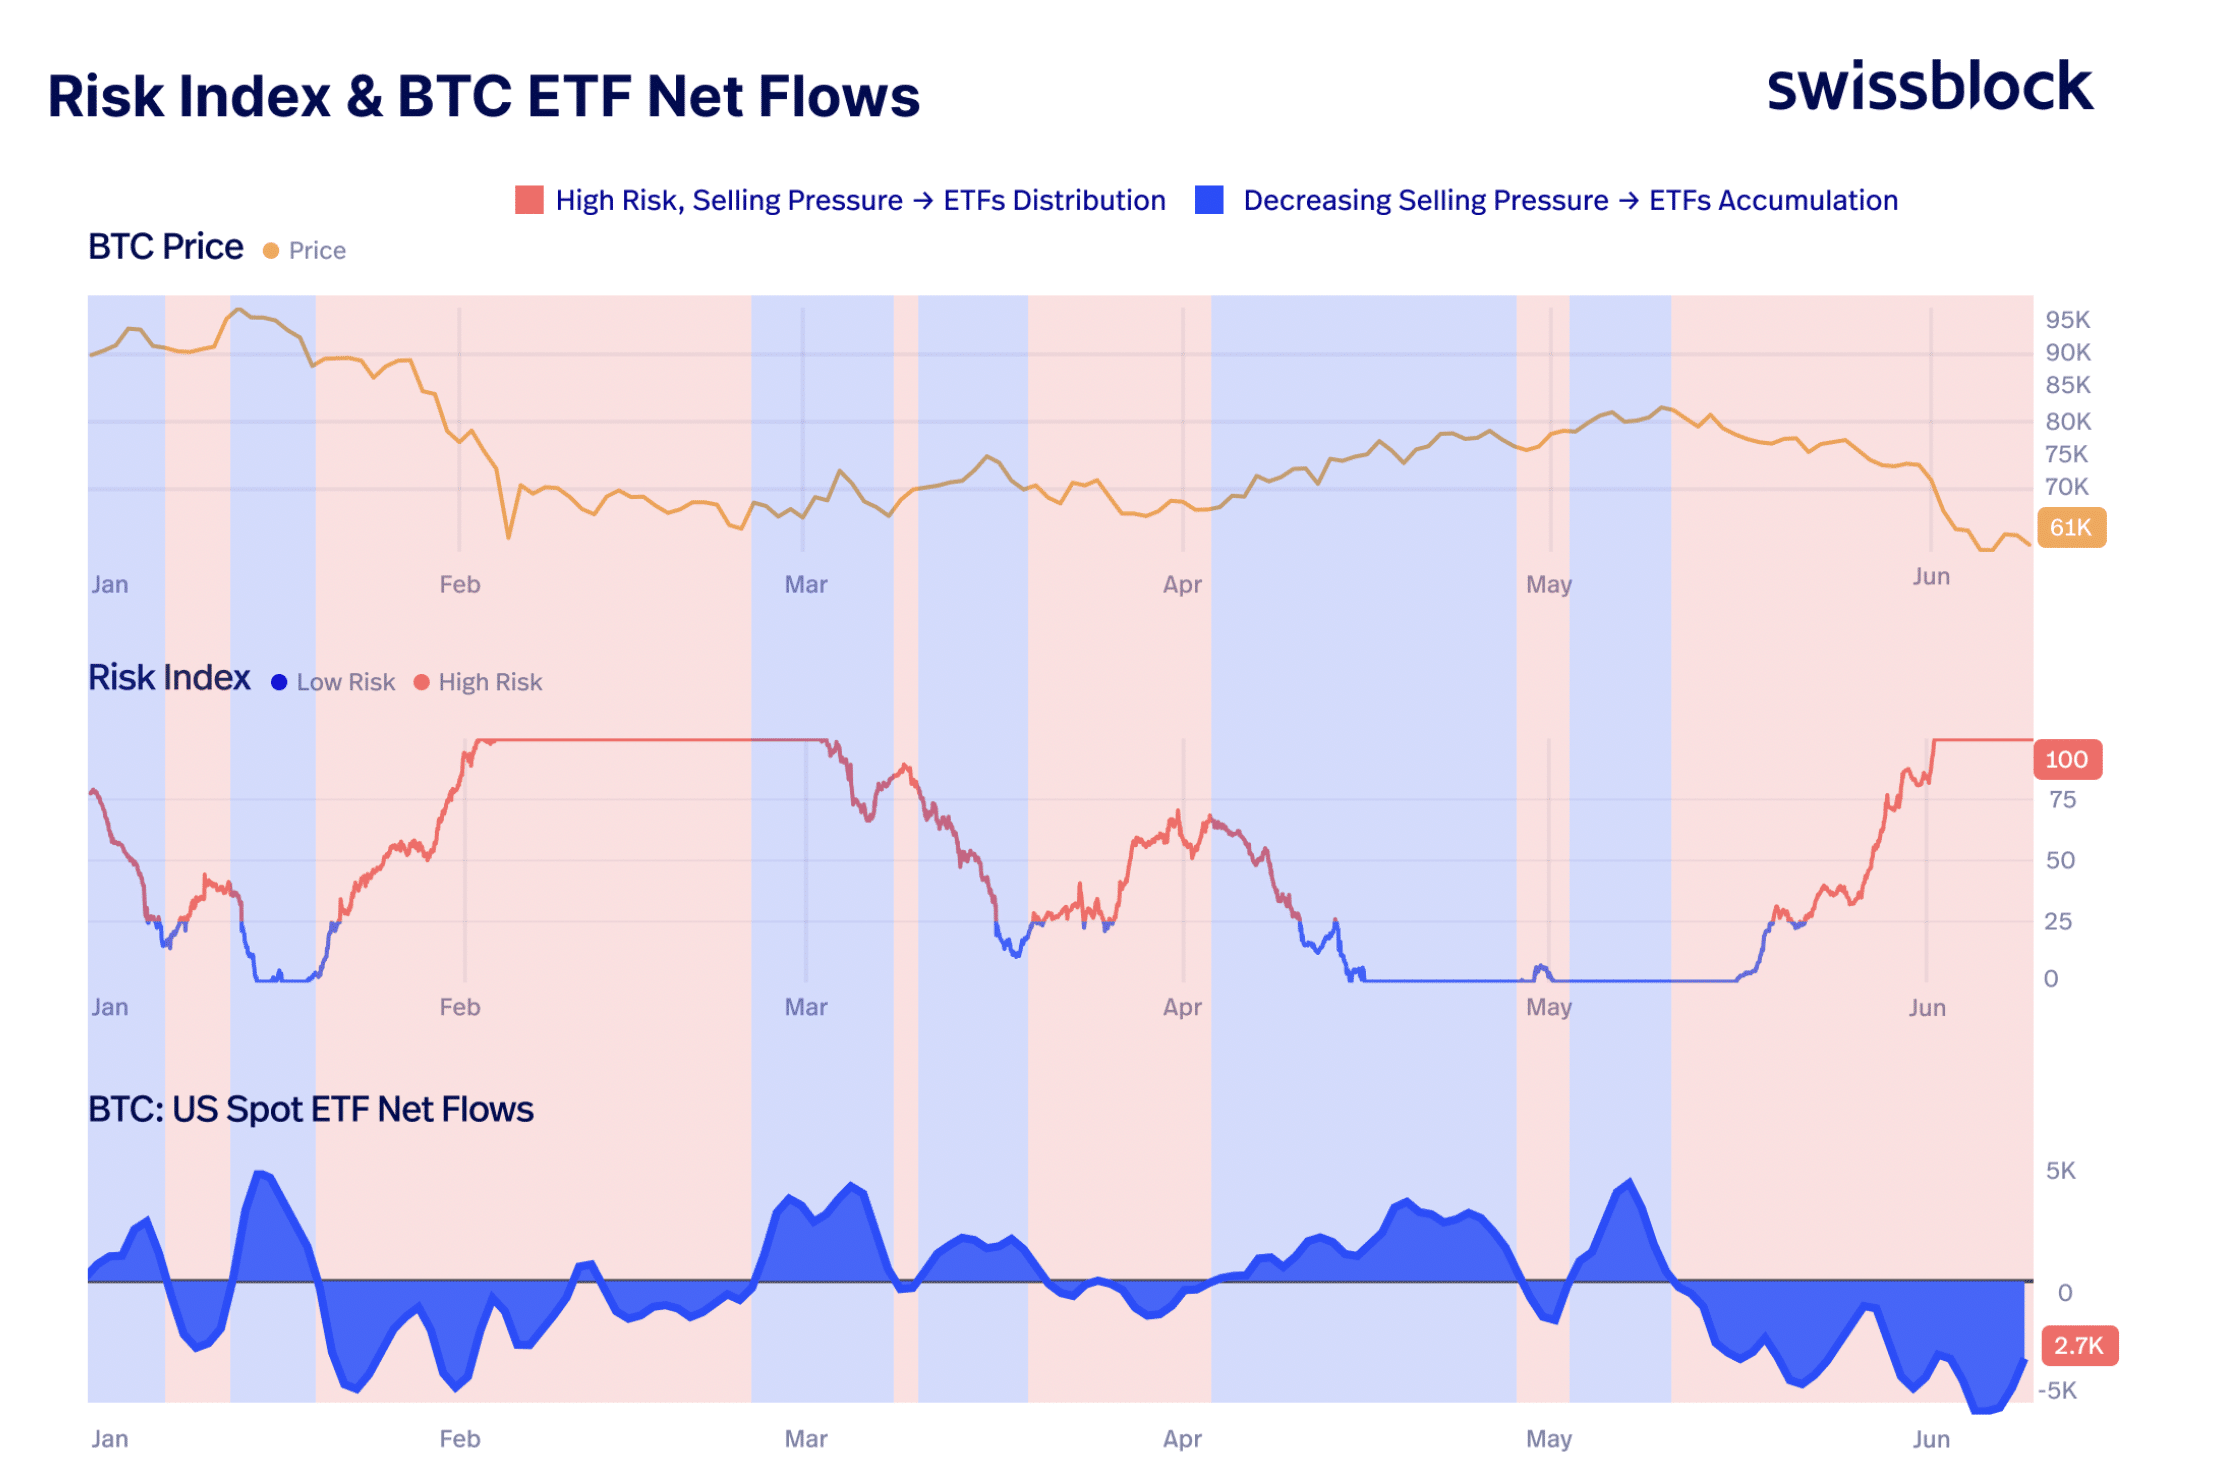
As the Risk Index rises to 100, the highest level on the chart, Bitcoin falls to around $61,000, indicating strong selling pressure. Meanwhile, there have been notable net outflows from US spot Bitcoin ETFs, suggesting that institutional investors are reducing rather than increasing their exposure.
All-in Swissblock put it best when they noticed,
The sales pressure is being absorbed again. The key now is to look for the first accumulation signals. As long as the risk remains capitulation risk, Bitcoin will remain under structural pressure.
Final summary
- While some market analysts believe the downtrend is still in place, others point to historically oversold RSI levels as a possible bottom signal.
- Growing indications of surrender are evident in on-chain data, as CryptoQuant’s Bitcoin Supply in Loss metric crosses 50% for the first time since the FTX-driven bottom in November 2022.