
 Recovery Gains Traction: Can It Deliver Bigger Profits?")
Dogecoin started a new rise from the $0.0850 zone against the US dollar. DOGE now faces hurdles near USD 0.090 and could be aiming for a bigger rally.
- DOGE price started a decent upward move above USD 0.0850 and USD 0.0880.
- The price is trading above the USD 0.0870 level and the 100-hour simple moving average.
- A bullish trendline is forming with support at $0.0870 on the hourly chart of the DOGE/USD pair (Kraken data source).
- The price could continue to rise if it remains above $0.0850.
Dogecoin price faces hurdles
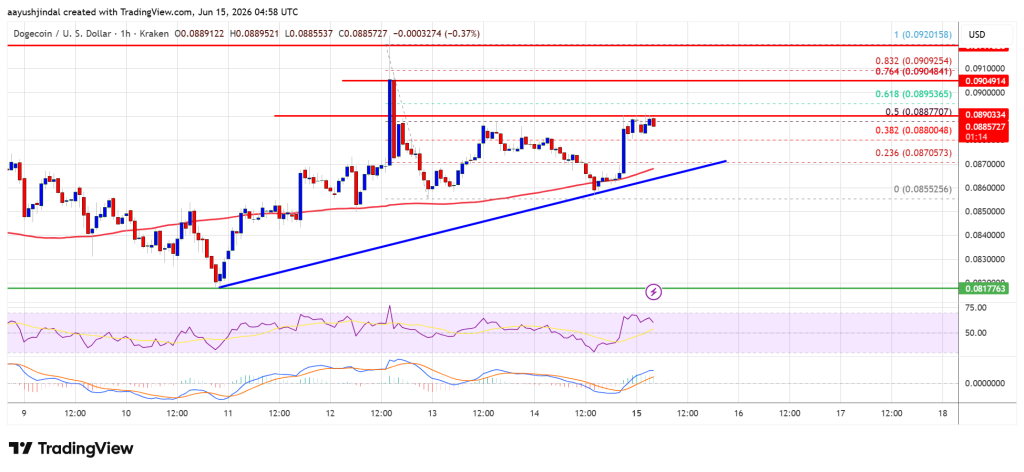
Dogecoin price remained supported above the $0.0850 zone and started a new increase, just like Bitcoin and Ethereum. DOGE climbed above the $0.0865 and $0.0870 resistance levels.
The price gained more than 2% and tested the $0.0890 zone. There was a move above the 38.2% Fib retracement level of the downward move from the $0.0920 swing high to the $0.0855 low. Furthermore, a bullish trendline is forming with support at $0.0870 on the hourly chart of the DOGE/USD pair.
The Dogecoin price is now trading above the $0.0870 level and the 100-hourly moving average. If the bulls remain active, the price may try to rise again. Immediate resistance on the upside is near the $0.0890 level and the 50% Fib retracement level of the downward move from the $0.0920 swing high to the $0.0855 low.
The first major resistance for the bulls could be near the $0.0905 level. The next major resistance is near the $0.0920 level. A close above the resistance at $0.0920 could send the price towards the resistance at $0.0950. Any further gains could send the price towards the USD 0.10 level. The next big stop for the bulls could be $0.1050.
Another drop in DOGE?
If DOGE price fails to rise above the USD 0.090 level, it could continue to decline. The initial downside support is near the $0.0870 level. The next major support is near the $0.0855 level.
The main support is at $0.0850. If there is a downside break below the USD 0.0850 support, the price could fall further. In the mentioned case, the price could slide towards the $0.0820 level or even $0.080 in the short term.
Technical indicators
Hourly MACD – The MACD for DOGE/USD is now losing momentum in the bullish zone.
Hourly RSI (Relative Strength Index) – The RSI for DOGE/USD is now above the 50 level.
Major support levels – $0.0870 and $0.0855.
Major resistance levels – $0.090 and $0.10.