

A divergence in a volatile market can go both ways.
On the bullish side, if volatility turns higher, a bear trap could take Bitcoin back above key resistance levels, triggering short squeezes and adding fuel to the FOMO trade. On the other hand, as volatility turns lower, a deeper correction could trap overexposed long positions and heighten the market’s sense of risk.
Right now, Bitcoin’s technical setup appears to be playing out in real time. As macro uncertainty diminishes, the backdrop could be tilting towards a bullish scenario.
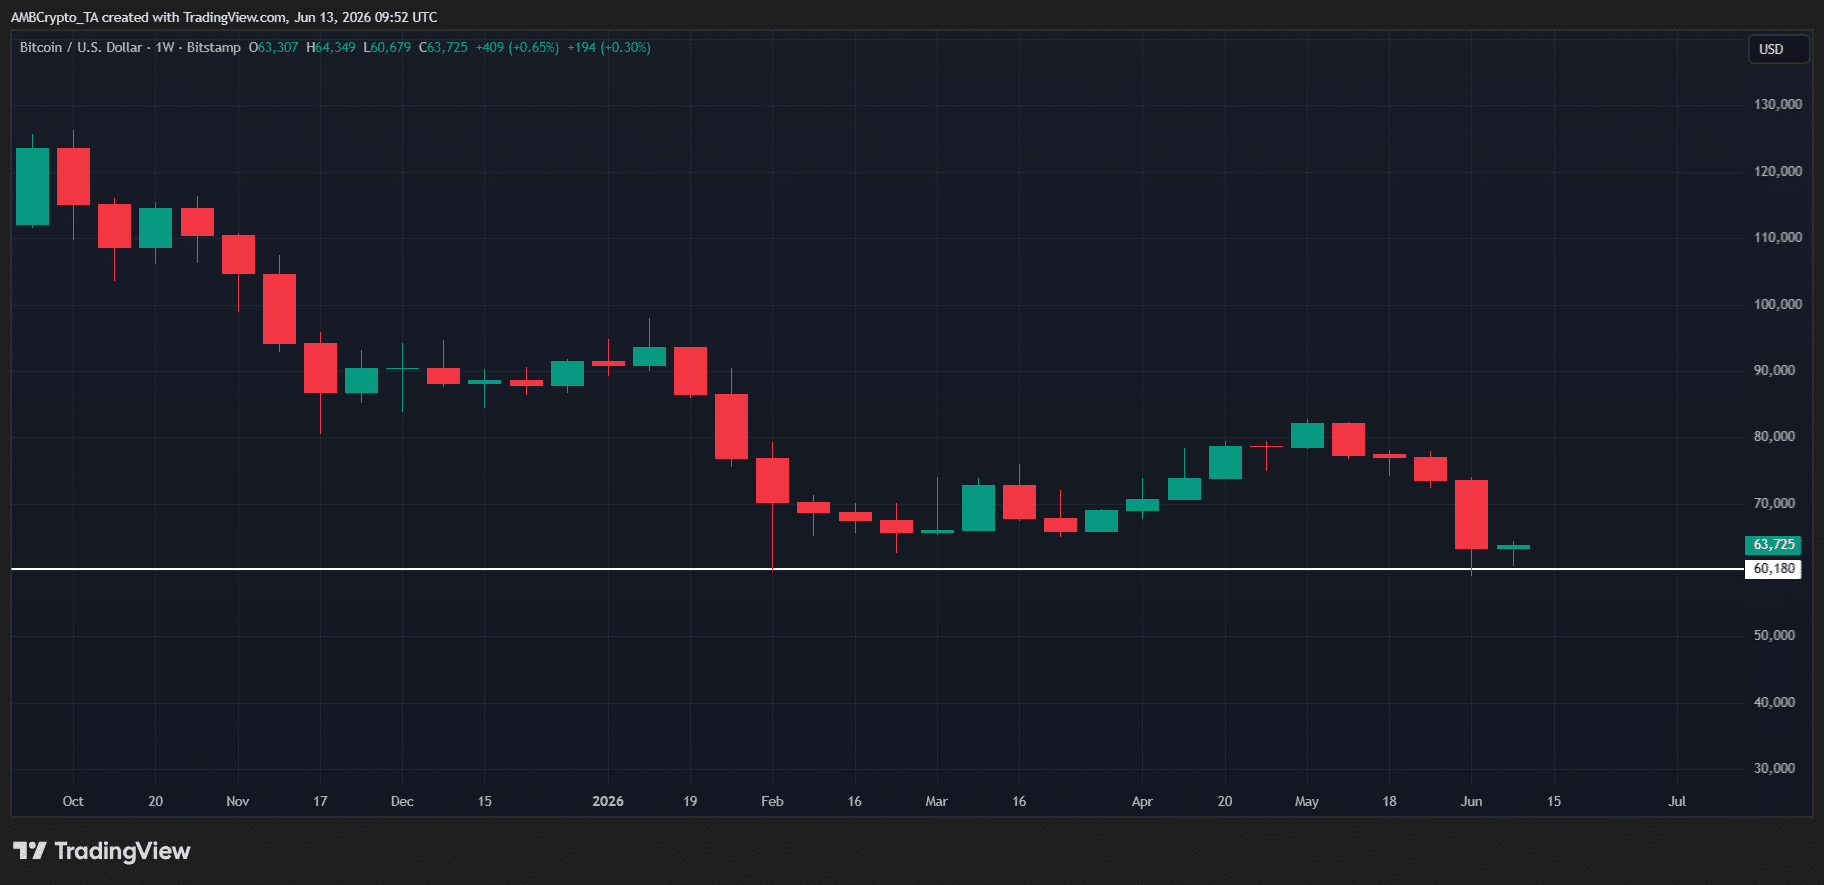
Meanwhile, BTC has continued to chop sideways around $65,000, creating the kind of liquidity-rich environment where a classic bear trap could occur.
Hard data also seemed to support this design.
Notably, oil prices have resumed their downward trend after the nearly 70% rally in the first quarter, which coincided with Bitcoin’s 22% correction. This relationship is hard to ignore, especially as investors consider the longer-term inflationary impact of rising energy costs, putting pressure on risky assets like BTC.
Fast forward to Q2, and the picture starts to shift. Oil prices are down more than 17% so far this quarter, while Bitcoin has only corrected 6.5%. In other words, capital flows into oil have cooled significantly relative to Bitcoin [BTC] – A sign that investors’ risk appetite is gradually improving.
The ongoing peace agreement further supported this trend. As geopolitical tensions ease, investors are increasingly willing to get back into risky assets. This could help explain why Bitcoin has held up relatively well despite the recent correction.
This could raise the possibility that the current weakness is simply a liquidity clearing before the next move higher.
Macro relief versus on-chain caution – Bitcoin is in a divergence
Despite macro conditions cooling, this shift is still not fully reflected in Bitcoin’s on-chain signals.
For example, institutional capital is not yet showing a strong dip-buying response. BTC ETFs have continued to record net outflows, indicating that major players are not yet fully participating in the recent risk-on rotation.
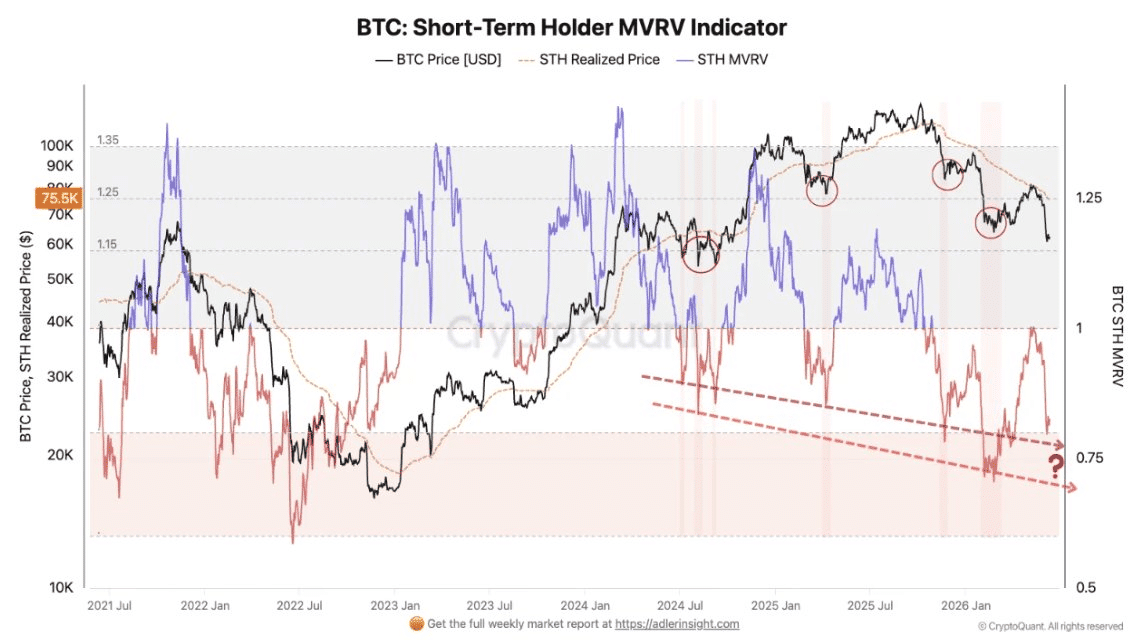
This weakness is also consistent with a recent CryptoQuant report. According to the chart below, Bitcoin may be entering a zone of historically marked bottom formation. However, BTC’s STH MVRV index still seemed to indicate more capitulation than confirmation – evidence that the market has not yet fully stabilized.
Against this backdrop, a rise in Bitcoin Open Interest could indicate a higher risk situation.
As one analyst noted, BTC Open Interest has remained high compared to previous lows. Ideally, the market would settle further via a slow decline below $60,000 to reset positioning. Bitcoin’s press time differences between the macro setup and on-chain signals also supported this view.
This in turn could help explain why Kalshi traders are prices with a 69% chance that BTC will first drop to $55K before heading towards $100K. This describes it as a structured positioning scenario, rather than a random bet.
Final summary
- Bitcoin’s on-chain data and high Open Interest still look weak despite improving macro conditions.
- Mismatch supports the view of a possible drop to $55K, first to reset positioning, before a move to $100K.