

Bitcoin’s 200-week moving average, which is around $61,700, is the line the market is watching most at the moment.
That level marked the bottom of every major Bitcoin bear cycle dating back to 2015, and held steady again this week — at least for now.
Related reading
A classic bottom signal – or just a pause?
The sell-off dragged Bitcoin down to around $61,300 before buyers pushed the price back above $64,750, a recovery of more than 5%.
According to reports, the recovery came amid news that Israel and Lebanon had agreed to an agreement ceasefirealthough the price action itself was already shaped by a massive liquidation.
According to a report, more than $740 million in BTC holdings were wiped out within a span of 24 hours facts from CoinGlass. Long traders took the brunt of the blow, with more than $623 million in bullish bets liquidated as the price fell.
The bear flag still hangs
Bitcoin’s weekly chart shows that a bear flag breakout is still happening. The pattern points to a potential decline in the $50,000-$52,000 range, and the setup has gained weight due to rising trading volumes that are trending down.
BTC has so far failed to regain the upper flag trendline. This failure keeps the bearish scenario technically intact even after Thursday’s rebound.

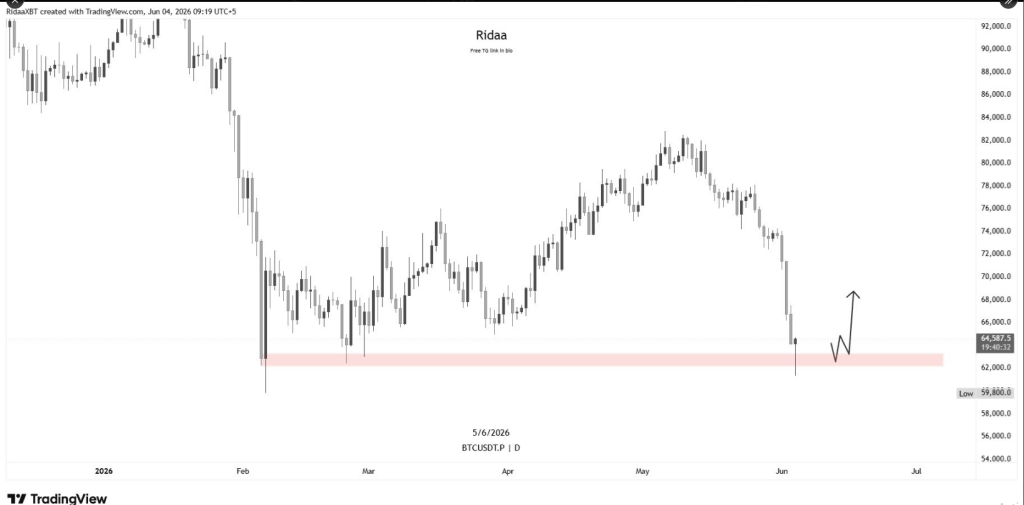
Some traders interpret the move differently. Analyst ZordXBT pointed to the long lower wick on the Bitcoin candle as a sign that buyers were getting close to the lows. Trader RidaaXBT called for a short term bouncing relief towards the $69,000-$70,000 range, arguing that the liquidation wave may have removed enough short-term selling pressure to allow a recovery.
Thus, BTC fell to the 61k level, which is likely the local bottom for now.
We expect a relief from here, with a possible return towards the 69k-70k region. https://t.co/q5VGRG2Id1 pic.twitter.com/83U7H7Phog
— Ridaa (@RidaaXBT) June 4, 2026
Not everyone is convinced
Not all market watchers believe in the optimism. Trader Hitman42.eth warned that bulls may be trapped, suggesting the jump could lure new long positions before another leg comes down.
everyone is cheering this $3k bitcoin: native bounce completely ignores the graveyard they just walked through.
$600 million in longs evaporated in 60 minutes. we touched $61k just above the February low and bounced.
Catching a falling knife after a structural flush is… pic.twitter.com/5QpE8Vv8Rc
— hitman42.eth (@ihitman42) June 4, 2026
The 200-week moving average remains the most important dividing line. As long as BTC holds above $61,700, the bear flag breakdown will not be confirmed. A convincing recovery from that level would put $70,000 back in play as the next meaningful price target.
Related reading
Bitcoin has tested the 200-week average at major lows before – in 2018 and again during the March 2020 crash – and rebounded sharply each time.
Whether this week’s touch of that level marks a similar turning point, or just a brief pause before a deeper decline, remains an open question.
Featured image of Gemini, chart from TradingView