
Bitcoins price recovery no new beginning: it is a familiar ending. That’s the warning from one crypto analyst, who believes that the current Bitcoin price action is a bull trap that the market has seen before and that the setup points to a destination where the cryptocurrency will crash by almost 50% from current price levels.
Related reading
Bitcoin reflects the key stepping stones of the 2022 bear cycle
Chiefy’s analysis focuses on a structural comparison between Bitcoin’s current price movement and the incremental decline that defined the 2022 bear market. The framework identifies a pattern of stepping stones for the bear cycle, a series of lower highs and lower lows dressed up as a recovery on the weekly candlestick time chart.
This analysis is with reference to Bitcoin’s price action since breaking above $82,000 earlier this week. Bitcoin is breaking through the 1-day 200 moving average, a zone that has already acted as resistance during a previous failed recovery attempt in January 2026.
The analyst also pointed out the one-week moving average of 200 at the lower support area and the one-month moving average at 350 below, suggesting a breakdown could force BTC through multiple long-term trend levels before finding a stronger base.
This is exactly the same as the 2022 bear market. In the previous bear cycle, Bitcoin did not fall in a straight line. It produced relief rallies that looked convincing enough to draw traders back in, only for the price to reverse again.
Based on this view, the current rebound will be towards the $80,000 range is not the beginning of a lasting outbreak. It is the biggest bull trap of the cycle. His projected path after the bull trap will see Bitcoin depart $82,000 and then freefall to $50,000, then recover to $63,000, and finally crash back to $42,000.
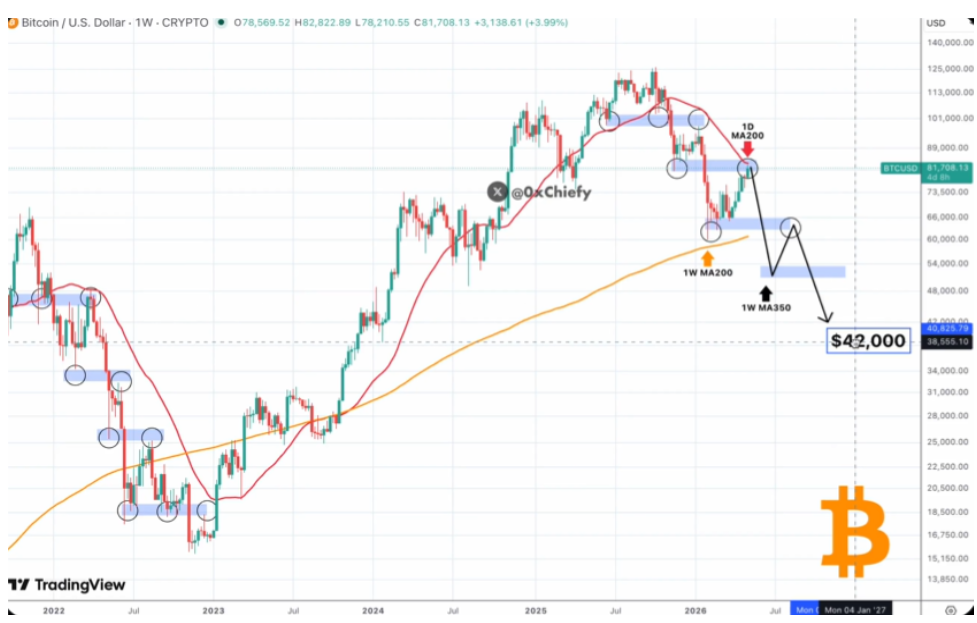
Bitcoin price chart. Source: @0xChiefy On X
Why this rally cannot be trusted
The next step in the range, a crash to $50,000, would represent a decline of around 39% from current levels. The subsequent jump to $63,000 would briefly restore confidence before the final decline to $42,000 completes the pattern. This latest descent will translate into a near 50% crash from current levels.
Interestingly enough, CryptoQuant researchers warned about this Bitcoin’s apparent demand measure, which tracks changes in estimated 30-day spot purchasing activity, remained negative throughout April’s price rally. This shows that the move in late April and early May that took Bitcoin to $80,000 was largely due to higher demand for perpetual futures, which is exactly the same as the start of the 2022 bear market.
Related reading
The crash warning also comes at a time when Bitcoin ETF flows no longer offering a clear bullish backdrop as they have now posted consistent net outflows totaling $423.15 million over the past two days.
At the time of writing, Bitcoin is trading at $80,367.
Featured image from Unsplash, chart from TradingView