

Bitcoin’s brief dip below $80,000 over the past 24 hours has exposed a more vulnerable market after weeks of gains, but options traders don’t yet see the pullback as the start of a deeper collapse.
According to CryptoSlate According to data, the pullback erased part of a rally that had taken Bitcoin about 37% higher since early April, as traders began rebuilding exposure after a tough first quarter. BTC has recovered to $80,360 as of the time of writing.
Yet a deep dive into options pricing, volatility metrics, and on-chain behavior reveals a market that is consolidating rather than capitulating.
Unlike the brutal pullbacks of the past, which were often caused by macroeconomic headwinds, this week’s decline appears to be a mechanical byproduct of the cryptocurrency’s internal market structure.
With traditional stocks like the S&P 500 and Nasdaq Composite hovering near record highs, Bitcoin’s local weakness points to a combination of depletion, profit-taking and unwinding of overextended long positions.
How Bitcoin’s Market Structure Made It Break Below $80,000
Bitcoin’s brief decline below $80,000 was not so much caused by a shift in macro sentiment, but rather by pressure within the crypto market itself.
The first source of stress came from profit taking. After rising about 37% from the April low, Bitcoin pushed a large group of recent buyers back into profits, giving traders who had spent months underwater a reason to reduce exposure.
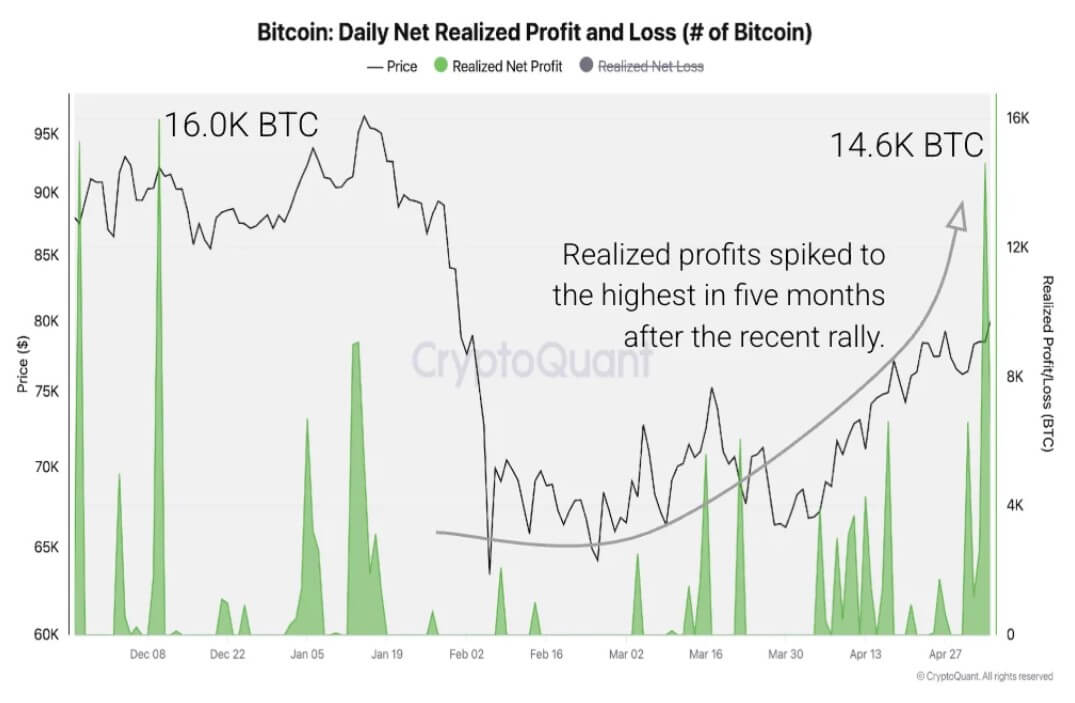
Data from CryptoQuant shows that investors made a profit on 14,600 Bitcoin on May 4, the largest single-day profit-taking event since December 2025. The Short-Term Holder Spent Output Profit Ratio, which tracks whether recent buyers are selling coins at a profit or loss, rose to 1.016 and has remained above 1 since mid-April.
This shift is significant because it shows that newer holders are no longer selling due to distress. Instead, they sold the power of the market.
The behavior reflects the damage left by the first quarter downturn.
In February and March, many short-term traders had unrealized losses of 20% to 30%. The recovery in April repaired much of that damage and created a natural exit point for investors who had been waiting for a return to breakeven or modest profits.
Meanwhile, the same pattern is visible in unrealized profits. Bitcoin traders are now sitting on a total profit margin of about 18%, the highest since June 2025.
CryptoQuant said similar levels have historically coincided with heavier distribution as traders use relief gatherings to take money off the table.
However, sales have not yet developed into broad distribution. Currency inflows remain subdued, indicating that large holders are not aggressively moving coins to centralized platforms. That limits the bearish signal from the latest profit-taking and instead points to a market consuming gains after a sharp recovery.
At the same time, the second source of pressure came from the derivatives market, as Bitcoin’s rally in early May was driven by a rapid return of leverage in perpetual futures markets.
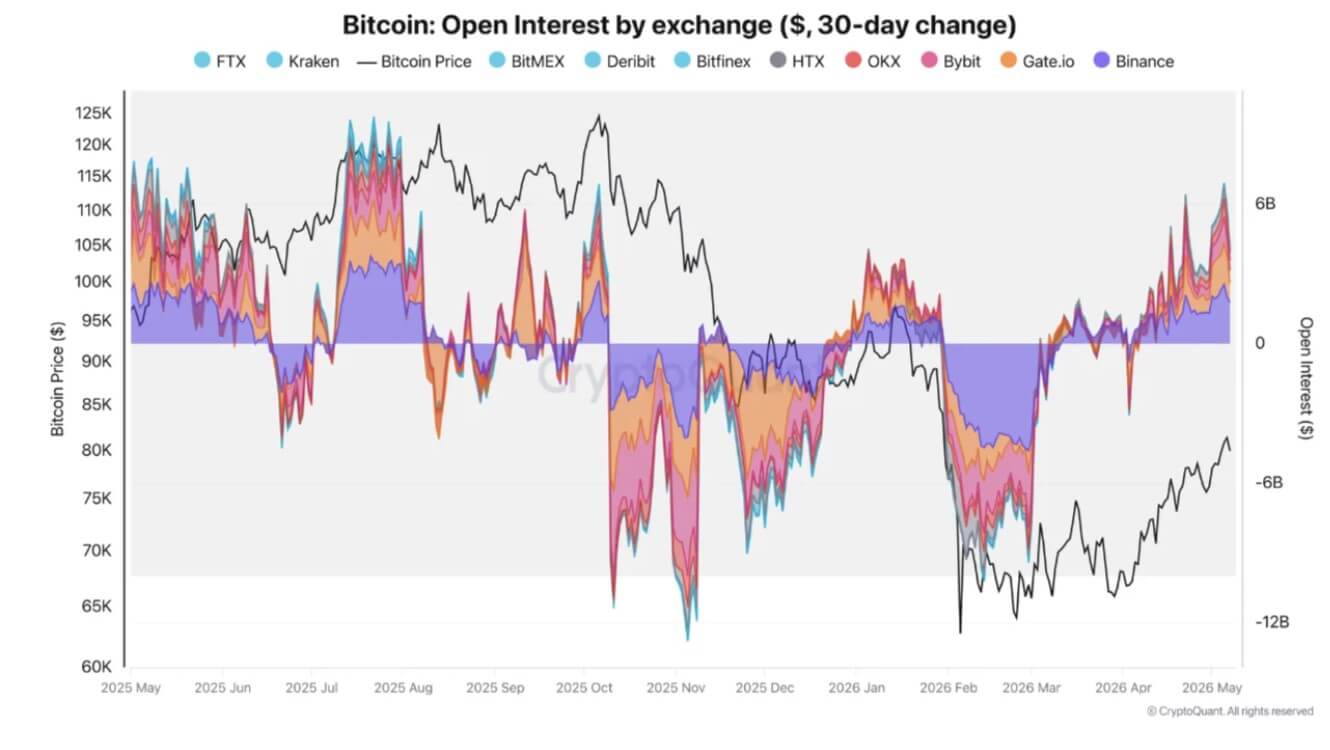
Data from CryptoQuant shows that BTC open interest, or the total value of outstanding derivatives contracts, recorded the largest increase of 2026. The expansion was even greater than the build-up around Bitcoin’s 2025 record.
Binance remained the center of that activity, representing about 34% of the market, with an average monthly open interest of $2.5 billion. Gate.io and Bybit also saw increased activity, reflecting a broader return of risk appetite on the major trading platforms.
That influence helped fuel the rally, but it also made the movement more vulnerable.
CryptoQuant analyst IT Tech noted that BTC funding rates fell to -0.031% per hour between May 2 and 4, the lowest level since the post-COVID-19 market stress of 2020. The deeply negative funding showed that traders had taken short positions just as liquidity was building above the market.
When Bitcoin broke through $78,600, these shorts were forced to relax. From May 4 to 6, approximately $535 million in short positions were liquidated, accelerating the move toward the $82,000 to $83,000 range.
Open interest rose from $26.5 billion to $29.1 billion during the squeeze, showing how much of the progress was driven by derivatives positioning rather than steady demand in the spot market.
The move below $80,000 was the other side of that process.
As the pressure subsided, open interest cooled again to around $26.7 billion. That drop has wiped out some of the speculative build-up that had lifted Bitcoin and reduced some of the immediate leverage risk.
Options traders shrugged off the pullback
While spot markets absorbed the selling pressure, the options market told a decidedly more optimistic story. Volatility, which had been compressed to its lowest level since October 2025, is being priced violently higher.
According to Glassnode factsthis volatility wave is entirely caused by the front of the curve. One-week implied volatility has risen significantly from recent lows, indicating renewed interest in short-term optionality.
At the same time, the 25-delta skew, a metric that measures the cost difference between bullish call options and bearish put options, is normalizing aggressively. After briefly showing a 5% premium for puts, the front-end skew is compressing back towards neutral.

The broader skew index, which evaluates the entire options curve, paints an even clearer picture: Downside hedges are actively unwound and demand for upside exposure is steadily increasing.
The market is effectively signaling that while traders maintain some basic protection, they viewed the brief dip below $80,000 as a temporary anomaly rather than a structural collapse.
Further complicating the price action is a huge cluster of shorts located near the $82,000 strike. Totaling nearly $2 billion, this concentration is forcing options traders to dynamically hedge their books.
In practice, this means that dealers are forced to buy based on market strength and sell based on market weakness, a mechanical reflex that naturally amplifies price swings in this particular trading range.
Trading volumes support the re-engagement thesis. Blockscholes data shows that daily derivatives volumes, which had languished between $800 million and $1.2 billion, exploded to more than $4 billion on the run toward $83,000.
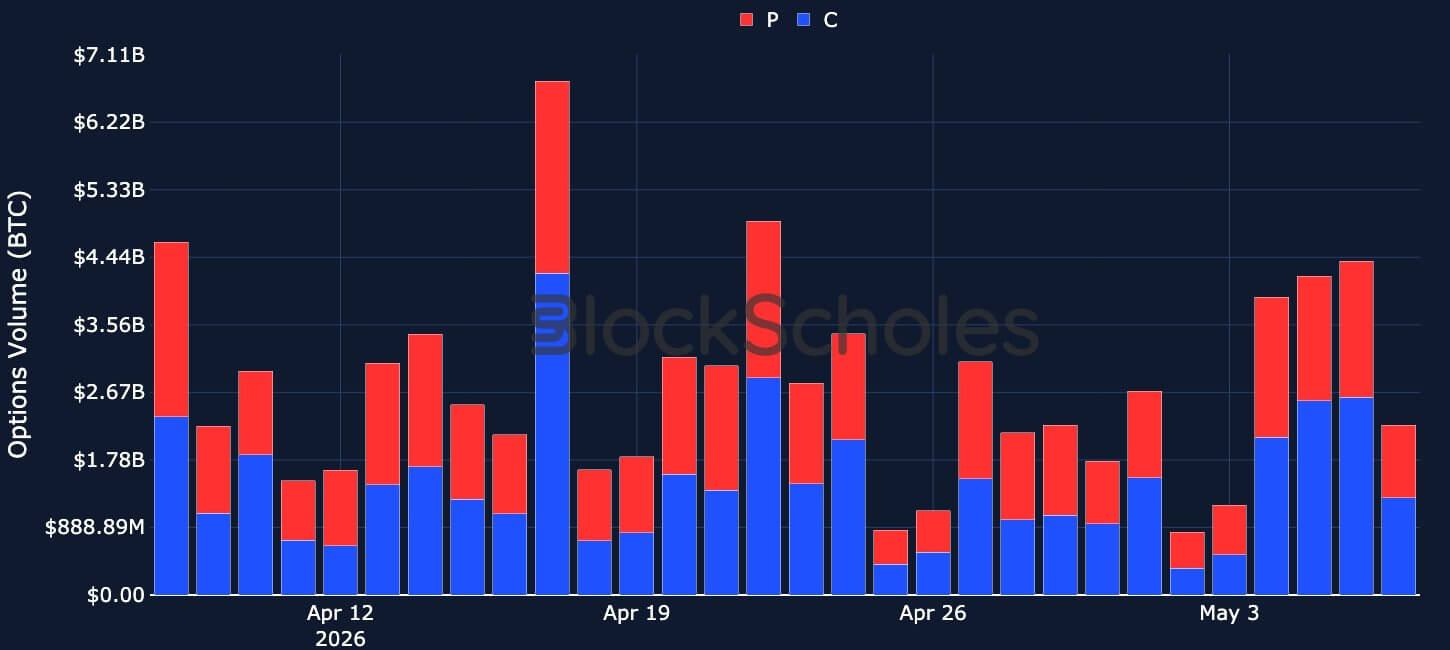
Despite the subsequent price decline, Blockscholes’ internal risk appetite index remains exceptionally strong, with a value of +1.1720.
The road to $88,000
Given the above, the prevailing market question is whether this entire sequence marks the genesis of an ongoing macroeconomic bull run or just the last, euphoric gasp of a prolonged bear market rally.
The answer probably lies in the behavior of cost-based clusters.
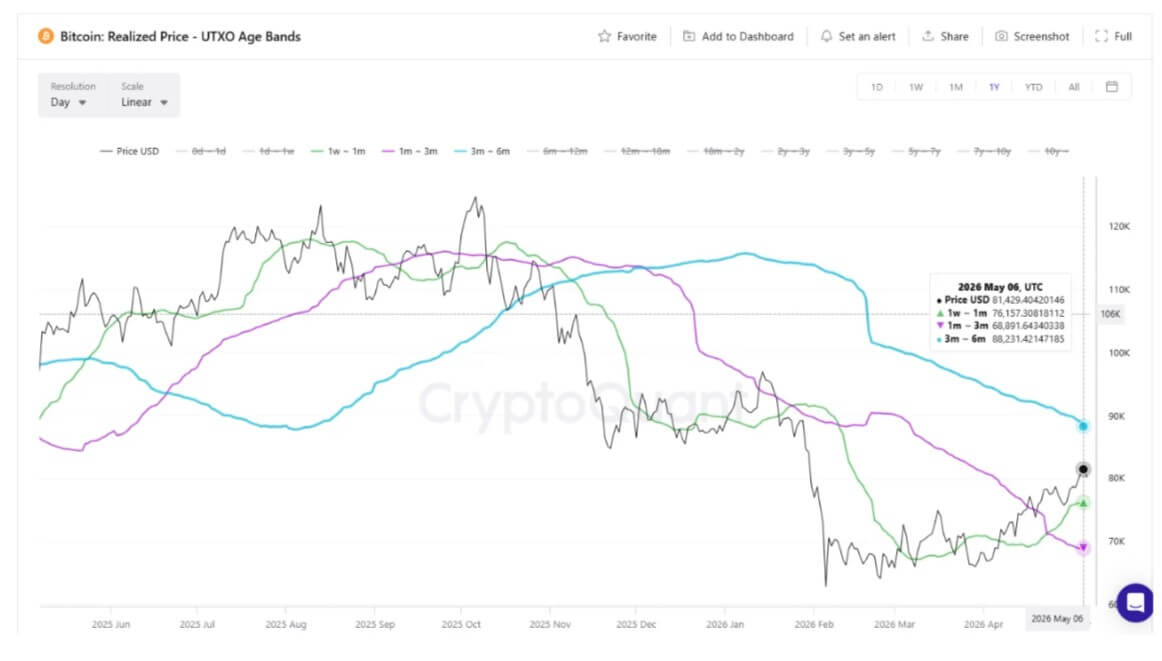
Facts from CryptoQuant shows that the era of unused transaction outputs (UTXOs) provides a map of where different cohorts of buyers acquired their coins.
A very bullish divergence is currently forming. The cost basis for the one- to four-week holder cohort has increased from $67,000 to $76,000, recently surpassing the one- to three-month cohort by $68,000.
In technical terms, this is a structural golden cross for the sentiment in the chain. Short-term holdings are the undisputed driver of market momentum.
When their overall position is underwater, they generate relentless selling pressure. However, when their positions align from the bottom up in terms of profits, they form the basis of a sustainable uptrend.
This fundamental alignment is currently being put into place, setting the stage for the next major psychological and technical battleground: $88,000. This level represents the cost basis of the three to six month holder cohort and represents the ultimate barrier to resistance.
If derivative demand continues to absorb spot gains and Bitcoin can successfully reclaim and hold $88,000, this would push each short-term cohort into profits at the same time.
Historically, that specific trigger has been the undeniable catalyst for a true trend reversal, turning cautious optimism into widespread retail euphoria.