

Bitcoin price started a recovery wave above $67,500. BTC is now consolidating below $68,800 and could struggle to stay higher.
- Bitcoin started a recovery wave above $67,000 and $67,200.
- The price is trading above USD 67,000 and the 100 hourly moving average.
- A rising channel is forming with resistance at $68,800 on the hourly chart of the BTC/USD pair (data feed from Kraken).
- The pair could fall again if it stays below the $68,500 and $68,800 levels.
Bitcoin Price Eyes recovery
Bitcoin price formed a base above $65,500 and initiated a recovery wave. BTC was able to settle above $66,000 to move into a positive short-term zone.
The price climbed above the USD 67,200 resistance zone. The bulls even crossed the 38.2% Fib retracement level of the downward move from the $71,986 swing high to the $65,030 low. However, the bears are now active near the USD 68,500 resistance zone.
Bitcoin is now trading above $67,000 and the 100 hourly moving average. If the price remains stable above $67,000, another move up can be attempted. Immediate resistance is near the $68,500 level or the 50% Fib retracement level of the downward move from the $71,986 swing high to the $65,030 low.
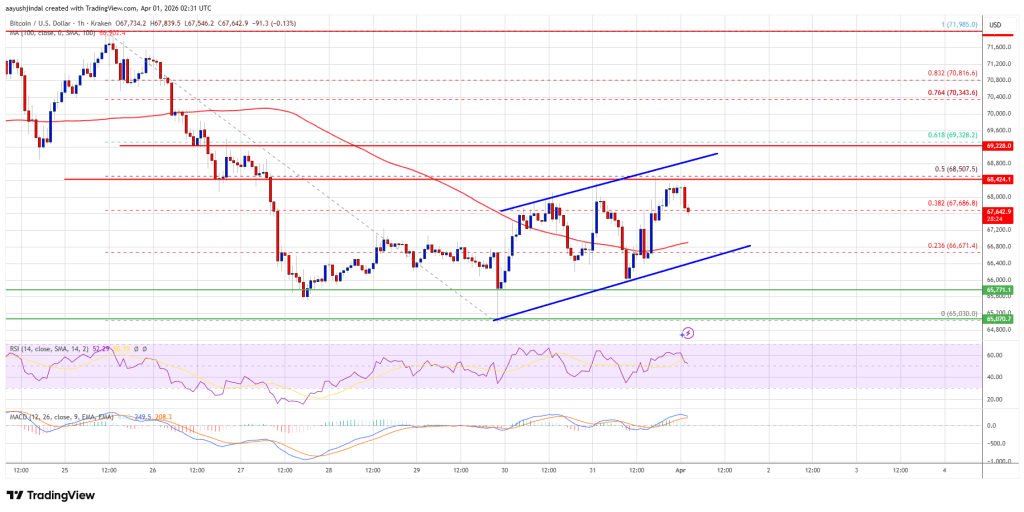
The first major resistance is around the $68,800 level. An ascending channel is also forming with resistance at $68,800 on the hourly chart of the BTC/USD pair. A close above the resistance at $68,800 could send the price higher. In the mentioned case, the price could rise and test the USD 69,250 resistance. Any further gains could send the price towards the USD 69,500 level. The next barrier for the bulls could be $70,000.
Another drop in BTC?
If Bitcoin fails to rise above the USD 68,800 resistance zone, it could trigger another decline. Immediate support is near the $67,000 level. The first major support is near the $66,800 level.
The next support is now near the $65,800 zone. Any further losses could send the price towards the USD 65,800 support in the short term. The key support now lies at $65,000, below which BTC could struggle to recover in the near term.
Technical indicators:
Hourly MACD – The MACD is now losing pace in the bullish zone.
Hourly RSI (Relative Strength Index) – The RSI for BTC/USD is now above the 50 level.
Major support levels – USD 67,000, followed by USD 65,800.
Major resistance levels – $68,500 and $68,800.