

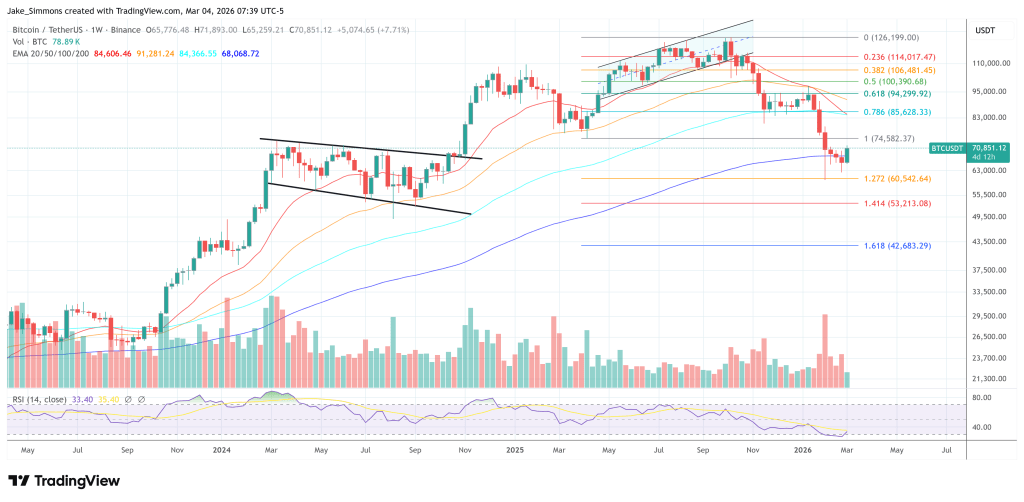
Bitcoin climbed back above $71,000 on Wednesday, reaching its highest level since February 8, even as broader geopolitical risk remained high. This move appears to have been caused by a sudden shift in macro sentiment around Iran, but the market structure within crypto had already primed BTC for a sharp turnaround.
Why did the Bitcoin price rise today?
The immediate catalyst came from a report cited by The Kobeissi Letter, which stated that the New York Times had reported that Iran had made a “secret” offer to the US to negotiate an end to the war. According to Kobeissi, the proposed framework included Iran abandoning or sharply curtailing its ballistic missile and nuclear programs, as well as reducing support for proxy groups, while President Donald Trump had “suggested” that Iran’s surviving leaders could remain in power under a so-called “Venezuela model.”
Related reading
Kobeissi added that “it remains unclear whether a deal is feasible at this time,” but the timing aligned with a rapid risk response in the U.S. stock futures markets and Bitcoin. That macro headline helps explain the spark. It doesn’t fully explain why Bitcoin reacted more strongly than stocks and gold. The positioning background is important for this.
BREAKING: US stock market futures rise as the New York Times reports Iran has made a “secret” offer to the US to negotiate a deal to end the war.
Possible terms include:
1. Iran will abandon or drastically curtail its ballistic missile and nuclear programs
2. Iran will give up… https://t.co/IsF3saWl1A
— The Kobeissi Letter (@KobeissiLetter) March 4, 2026
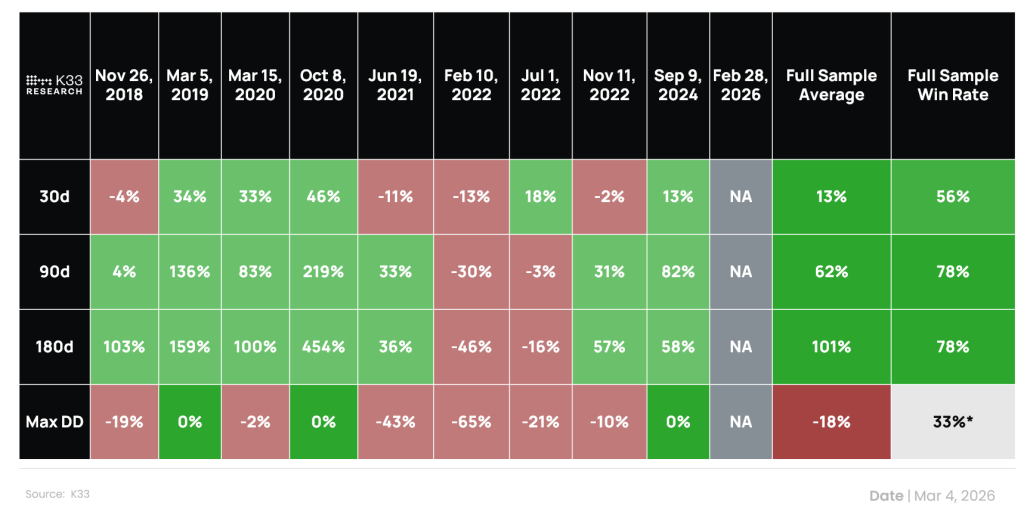
Vetle Lunde, head of research at K33 Research, argued that Bitcoin entered the past week in an unusually compressed state after months of persistent weakness. “Bitcoin entered the weekend heavily oversold, heavily shorted and significantly undersupplied,” Lunde wrote. “First and foremost, the context for BTC prior to the Iran war is vastly different from other asset classes. Bitcoin was down 50% after five straight months of decline. The weekly RSI fell to its third lowest value ever, meaning BTC entered the week uniquely oversold.”
In other words, Bitcoin did not enter the geopolitical shock from a position of strength. It came in after a deep wash. Lunde also noted that institutional exposure has already been significantly reduced, with spot ETFs seeing outflows of nearly 100,000 BTC and notional CME open interest falling 30% from October levels. That matters because, in his view, investors who were most likely to use BTC as a hedge against uncertainty had already reduced exposure, reducing the asset’s correlation with traditional macro trades.
Related reading
Within the derivatives, the setup looked even more asymmetrical. Lunde said perpetual funding rates were unusually low and traders had paid a premium to stay short for much of February. “This is atypical market behavior for BTC, an asset with a clear long bias,” he wrote. “Similar funding rate regimes have often appeared during troughs and historically reflected imbalances, overcrowding and depletion on the sell side.”
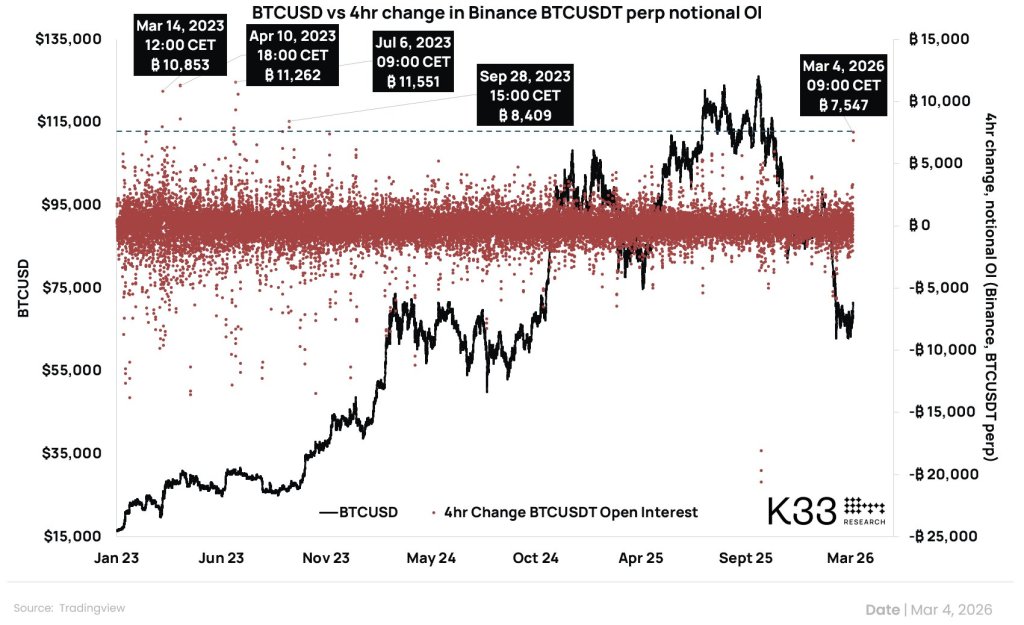
That imbalance quickly began to disappear as the price turned around. In a follow-up post, Lunde said Binance BTCUSDT perpetual open interest had risen by 7,547 BTC in just four hours, a jump that he said had not been seen on a comparable four-hour basis since 2023. That suggests the rally was not just a spot reaction to the headlines, but also a derivatives-led repositioning.
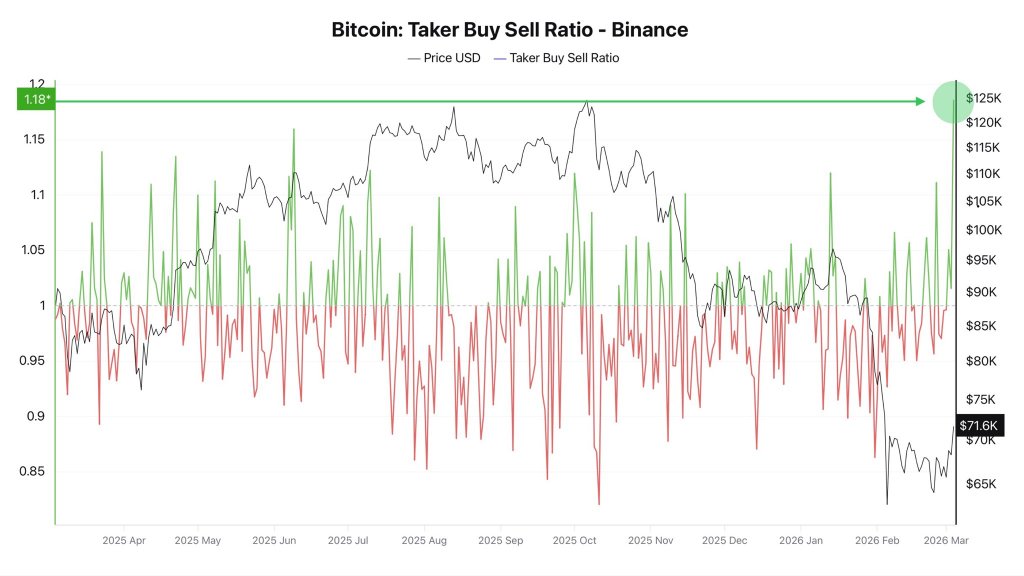
Crypto contributor Darkfost be on similar evidence. He noted that Bitcoin’s recovery above $70,000 was accompanied by five straight days of spot ETF inflows and a decisive turn in aggressive derivatives buying. On Binance, the BTC Taker Buy Sell Ratio reached 1.18, the highest value of the year, while taker buying volume exceeded $1 billion per hour several times during the session. Taken together, these signals suggest that buyers are no longer simply absorbing the selling pressure; they begin to dictate short-term price action.
At the time of writing, BTC was trading at $70,851.
Featured image created with DALL.E, chart from TradingView.com