

XRP on-chain pain has attracted new attention this week. Realized losses rose to nearly $2 billion in a week. This type of move catches the attention of traders because it often marks a clearing of weaker holders.
Related reading
Santiment shows heavy realized losses
According to Santiment the peak is the largest since 2022. Realized losses occur when people sell for less than they paid for. It is a measure of capitulation. In previous cycles, similar highs occurred near major lows, followed by strong rallies.
📉 BREAKING: XRP has seen the largest on-chain realized loss spike since 2022. When the previous weekly milestone of -1.93 billion in realized losses occurred 39 months ago, $XRP went up +114% over the next 8 months.
💸 Significant realized losses happen when a large number… pic.twitter.com/gPUU8fYfiY
— Santiment (@santimentfeed) February 21, 2026
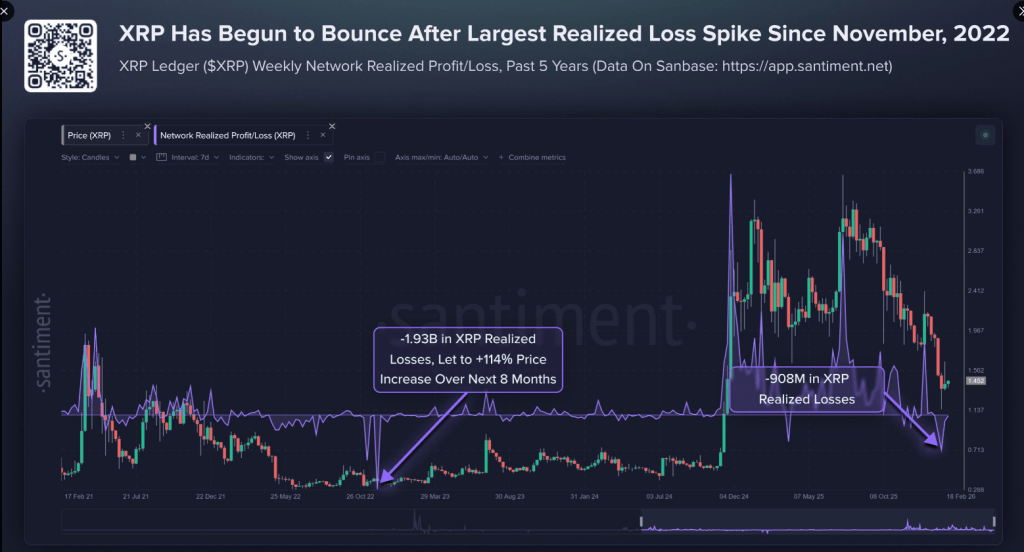
In one historical episode that traders point to, there was a big losing week followed by a 114% gain over a period of about eight months. Yet that outcome arose from a specific set of market conditions that are not guaranteed to occur again.
When many small holders leave
The recent spike in realized losses has caught the attention of market participants. When investors sell at a loss, the benchmark rises, reflecting the size of the coins changing hands below their purchase price. Analysts often monitor this data to assess shifts in supply and demand.
Realized profit and loss figures are often used to monitor market behavior during periods of sharp price movements. While the data highlights the level of losses, price direction generally depends on broader trading activity, liquidity conditions and general market trends.
Price movements and market tone
XRP was trading around $1.45 at the time of these reports, up about 1.50% over 24 hours, but down about 24% on the month. The token moved largely in lockstep with Bitcoin during a broader market rally.
Such short-term strength could be a start. It could also be a short reprieve within a longer correction. Traders looking at the charts want to see more volume and clear levels before calling it a trend change.
Mine #XRP price targets for the next three months:
March $13
April $27
May $70— CryptoBull (@CryptoBull2020) February 21, 2026
Why some predictions stretch reality
Analyst Objectives that encounter double and triple digits are circulating online. CryptoBull’s calls for $13, $27 and $70 within months are extreme and would require dramatic new capital flows.
Market cap math shows that these moves require much higher demand than the casual optimism provides. Other analysts used previous cycle lows to estimate a possible macro bottom between $0.75 and $0.85 by applying a multiple of roughly 2.8x.
Related reading
A good signal
All told, the data has revived discussion about a rare signal in the chain, which historically came ahead of 114% advances.
Santiment’s latest figures show realized losses reaching levels not seen since 2022, bringing the statistic back into focus for traders who track cycle behavior.
Whether history repeats itself will depend on incoming demand, broader crypto sentiment and continued buying pressure in the coming weeks. For now, the signal has flashed again and the market is watching to see what follows.
Featured image from Pexels, chart from TradingView