

Crypto analyst Charting Guy (@ChartingGuy) is charting a sharply asymmetric setup for XRP, arguing that the token is locked in a textbook Wyckoff reaccumulation and is “still NOT the least bit bearish” despite a year of range-bound trading.
Why XRP is still not bearish
His work is based on XRP/USD Bitstamp charts posted at X on November 27, 2025. On a weekly basis, The retracement is drawn from the cycle low near $0.11400 to that high, creating a ladder of levels that structures the entire position.
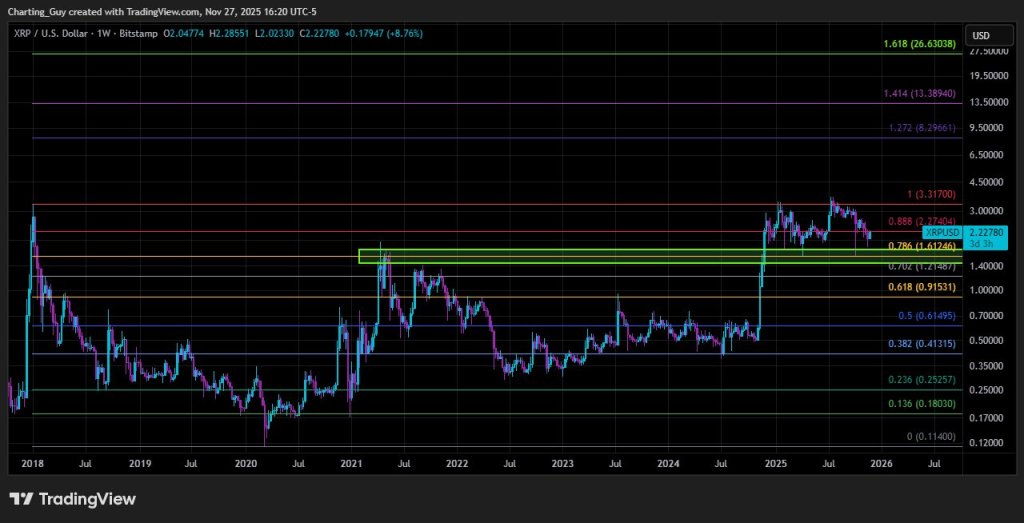
The key Fibonacci levels include 0.5 at around $0.61495, 0.618 at $0.91531, 0.702 just above $1.20 and, crucially, 0.786 at $1.61246. A broadly marked band covers the previous 2021 high zone and this cluster of 0.786, roughly from the mid-$1 to the low $2. Charting Guy describes this as XRP “building support at previous cycle highs and at the top of the gold pocket,” referring to the 0.618–0.786 retracement area.
Related reading
Above the 2025 high, he plots classic Fibonacci extensions: 1.272 at around $8.29661, 1.414 around $13.38940 and 1.618 near $26.63038. However, his immediate scenario stops below these levels and projects a move towards around $7.50.
XRP Price Roadmap for 2026
The detailed roadmap appears on a two-day XRP/USD chart overlaid with a Wyckoff schedule. The structure starts with a preliminary offer phase (PSY) and a buying climax (BC) in the low-$3 zone, followed by a secondary test (ST) and an automatic reaction (AR) that defines the lower limit of the range. Horizontal lines mark that floor near $1.61184, an intermediate band around $1.95, resistance at around $2.90 and the upper ceiling just above $3.30.
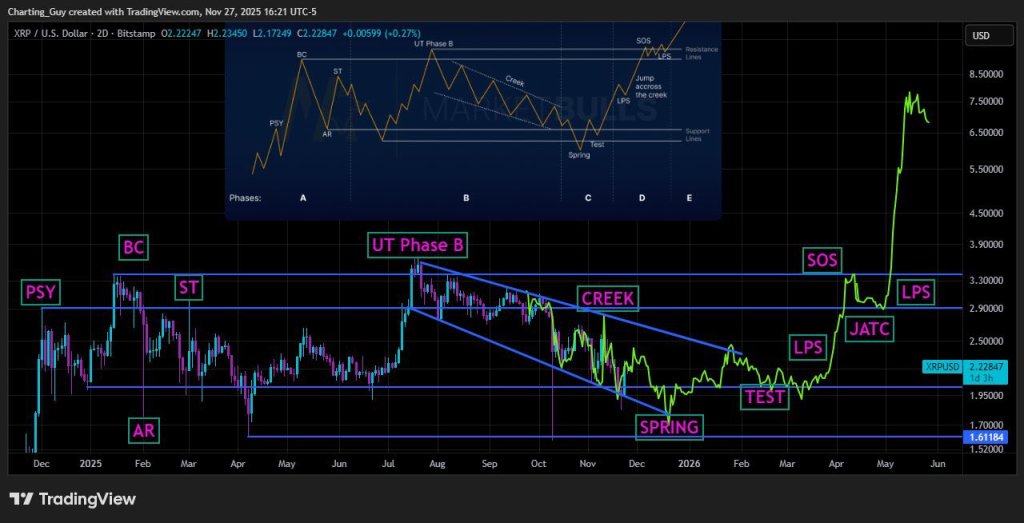
In mid-2025, XRP prints a “UT Phase B” upside at that $3+ resistance before rolling into a downsloping channel. The upper boundary of this channel, called ‘CREEK’, connects a series of lower highs, while the lower boundary takes the price back towards the support of $1.61–1.70.
In the scenario path, XRP spikes down to test the blue horizontal at $1.61184. This move is noted as the “SPRING” – Wyckoff’s final shakeout under range support. The price then recovers to recapture the $1.95 area marked “TEST” and establishes a higher low between around $2.00 and $2.20 as the first “LPS” (Last Point of Support).
Related reading
From there, the chart shows a decisive break in the descending ‘CREEK’ trendline, the ‘JATC’ or ‘Jump Across The Creek’, as XRP accelerates from around $2.20-2.30 through the resistance at $2.90. That breakout is followed by an “SOS” (sign of strength) above the former ceiling, with another LPS holding around $2.90 and confirming the move from resistance to support.
The right edge of the 2D diagram then projects a steep formatting phase. XRP rises from around $3.00 to just above $7.50 before stalling, even as it remains below the weekly extension of 1.272 at $8.29661.
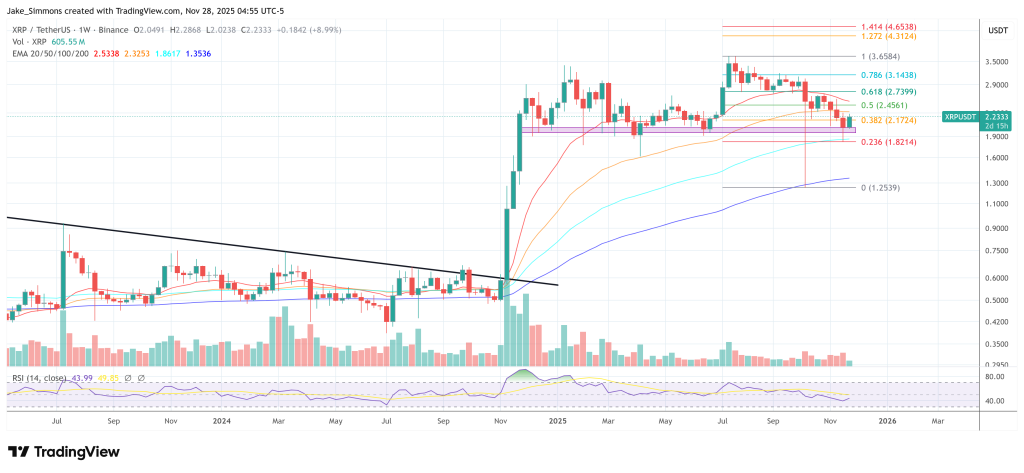
Beyond the charts, Charting Guy pushes back against the bearish momentum narrative surrounding the monthly RSI. He notes that the RSI peak occurred in January 2025 and “lost momentum throughout 2025, while XRP remained sideways within a range and held its own,” calling this “a very textbook example of reaccumulation signal where indicators lose power to reset and price remains stable.”
The technical message is unequivocal: as long as the $1.61–1.70 band holds, Charting Guy views XRP’s extensive consolidation as preparation, not distribution. A final flush below $1.70 is anticipated, followed by a Wyckoff-style breakout towards around $7.50.
At the time of writing, XRP was trading at $2.23.
Featured image created with DALL.E, chart from TradingView.com