

XRP price is consolidating gains above the USD 0.5850 level. The price could make a big move if it crosses the USD 0.6150 resistance zone.
- The XRP price is looking at a fresh increase from the $0.5850 level.
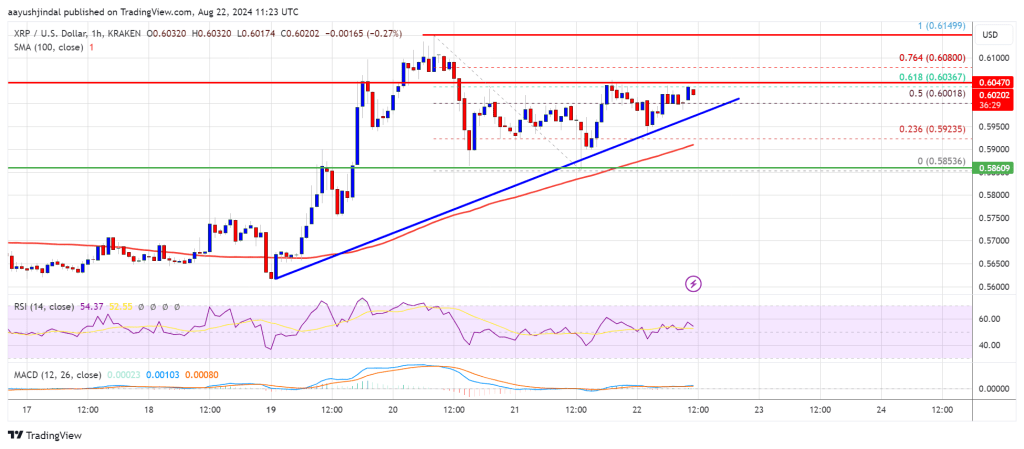
- The price is now trading above USD 0.5980 and the 100-hourly Simple Moving Average.
- A connecting bullish trendline is forming with support at $0.600 on the hourly chart of the XRP/USD pair (Kraken data source).
- The pair could start a new rise if it breaks the $0.6150 resistance zone.
XRP price aims higher
XRP price formed a base above the USD 0.5850 level. The price started a steady rise above the USD 0.5880 and USD 0.5920 levels like Bitcoin and Ethereum.
A bullish continuation pattern is forming from the $0.5850 level. The price gained speed for a move above the 50% Fib retracement level of the downward move from the $0.6149 swing high to the $0.5853 low. The price is now trading above USD 0.5980 and the 100-hourly Simple Moving Average.
A connecting bullish trendline is also forming with support at $0.600 on the hourly chart of the XRP/USD pair. If there is an upside continuation, the price could face hurdles near the $0.6050 level.
The 61.8% Fib retracement level of the downward move from the $0.6149 swing high to the $0.5853 low is also close to the $0.6050 level. The first major resistance is around the $0.6080 level. The next major resistance could be at USD 0.6150.
A clear move above the USD 0.6150 resistance could send the price towards the USD 0.6220 resistance. The next major resistance is near the $0.6350 level. Any further gains could send the price towards the near-term resistance at $0.6550 or even $0.6880.
Another withdrawal?
If XRP fails to break the USD 0.6050 resistance zone, it could trigger a short-term pullback. The initial downside support is near the $0.600 level. The next major support is at USD 0.5880.
If there is a downside break and a close below the USD 0.5880 level, the price could continue to decline towards USD 0.5650 in the near term. The next major support is at $0.5550.
Technical indicators
Hourly MACD – The MACD for XRP/USD is now gaining speed in the bullish zone.
Hourly RSI (Relative Strength Index) – The RSI for XRP/USD is now above the 50 level.
Major support levels – USD 0.600 and USD 0.5850.
Major resistance levels – $0.6050 and $0.6220.