Close Menu
  • News
    • Bitcoin
    • Altcoins
    • DeFi
    • Market Cap
  • Blockchain
  • Web 3
    • NFT
    • Metaverse
  • Regulation
  • Analysis
  • Learn
  • Blog
What's Hot

Hedera enables 19 live transactions with the Reserve Bank of Australia

2026-03-09

Bitcoin Reaches 20 Million Delivery Milestone as Final Coins Will Take 114 Years to Be Mined

2026-03-09

Altcoins are approaching historic stress levels as 38% of tokens are near all-time lows

2026-03-09
Facebook X (Twitter) Instagram
  • Contact
  • Terms & Conditions
  • Privacy Policy
  • DMCA
  • Advertise
Facebook X (Twitter) Instagram
Bitcoin Platform – Bitcoin | Altcoins | Blockchain | News Stories Updated Daily
  • News
    • Bitcoin
    • Altcoins
    • DeFi
    • Market Cap
  • Blockchain

    Hedera enables 19 live transactions with the Reserve Bank of Australia

    2026-03-09

    Aylab joins the REI network to accelerate the growth of the scalable web3 infrastructure

    2026-03-09

    Quack AI unveils production-ready Q402 on Avalanche C-Chain to scale agent workflows

    2026-03-09

    Quantum computers can break the privacy of Zcash and Monero, says researcher

    2026-03-09

    AI-agenten betreden cryptomarkten met ondersteuning van beurzen, portemonnees, databedrijven en meer

    2026-03-09
  • Web 3
    • NFT
    • Metaverse
  • Regulation

    SEC pressure on crypto giants fades as Trump-linked project draws $75M from Justin Sun

    2026-03-08

    Refusing new IRS crypto tax forms could cost you your exchange account

    2026-03-07

    US lawmakers consider ban on prediction markets amid bets on Iran

    2026-03-06

    De volatiliteit van Bitcoin zou in april kunnen exploderen als SEC de markt achter de ETF-leverage beoordeelt

    2026-03-06

    Crypto company Kraken secures a direct link to Federal Reserve payments

    2026-03-04
  • Analysis

    XRP’s unrealized losses soar to over $50 billion due to the oil price shock

    2026-03-09

    Bitcoin Price Drops Below $68,000, Downside Targets Come into Focus

    2026-03-09

    Bitcoin signals economic concerns as oil prices rise

    2026-03-09

    Ethereum Price Extends Pullback, Support at $1,920 Now Under Threat

    2026-03-09

    Solana (SOL) Plummets to $80, Traders Look to Critical Support Defense

    2026-03-09
  • Learn

    What Is Composability in DeFi and Why It Matters

    2026-03-09

    Hoeveel Crypto-portemonnees moet je echt hebben?

    2026-03-09

    What Is Wrapped ETH (WETH) and Why Do You Need It in DeFi?

    2026-03-06

    What Is Crypto Protocol and Why Coins Need It

    2026-03-04

    Wat is Liquid Proof-of-Stake: uitgelegd voor beginners

    2026-03-02
  • Blog
Bitcoin Platform – Bitcoin | Altcoins | Blockchain | News Stories Updated Daily
Home»Analysis»BNB sees $605 after breaking key resistance
Analysis

BNB sees $605 after breaking key resistance

2024-07-31No Comments3 Mins Read
Share
Facebook Twitter LinkedIn Pinterest Email

BNB has shown significant bullish momentum, with a positive candlestick crossing the 100-day Simple Moving Average (SMA) in a 4-hour time frame. The previous market scenario shows that the digital coin has been rejected several times at the $572 level.

This persistent resistance has paved the way for the bulls to take control and drive the price higher, aiming to reach the $605 resistance level. As market dynamics change, the key question is whether BNB can continue on its current path rising and reached the new goal of $605.

In this article, we will analyze BNB’s recent price movements using technical indicators to determine whether the price can maintain its momentum to reach $605 or fall back to $572.

Technical analysis points to a potential rise to $605

Technical analysis shows that BNB’s price has successfully broken above the 100-day Simple Moving Average (SMA) on the 4-hour chart, indicating a potential bullish trend and increased buying momentum. This view indicates that the price of BNB could continue to rise as long as it remains above the SMA.

BNB
Source: BNBUSDT on Tradingview.com

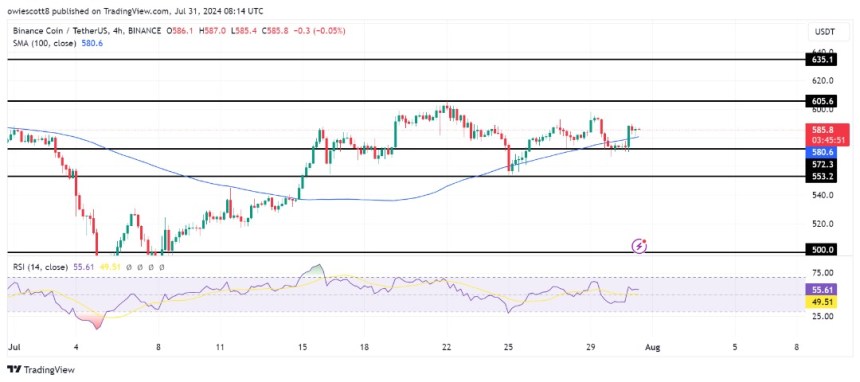
On the 4-hour chart, the Relative Strength Index (RSI) signal line has successfully risen above 50% into overbought territory, indicating a possible shift in momentum. This indicates that buying pressure is increasing and the asset may see further upside towards the $605.6 level.

Meanwhile, on BNB’s daily chart, the price is trying to move above the 100-day SMA. A successful crossing above this key technical level could signal potential bullish momentum. If BNB maintains its position above the 100-day SMA, it could trigger a continued uptrend and increased investor confidence.

See also  Bitcoin An increase of 15% in a month, warns analyst at MVRV resistance level
BNB
Source: BNBUSDT on Tradingview.com

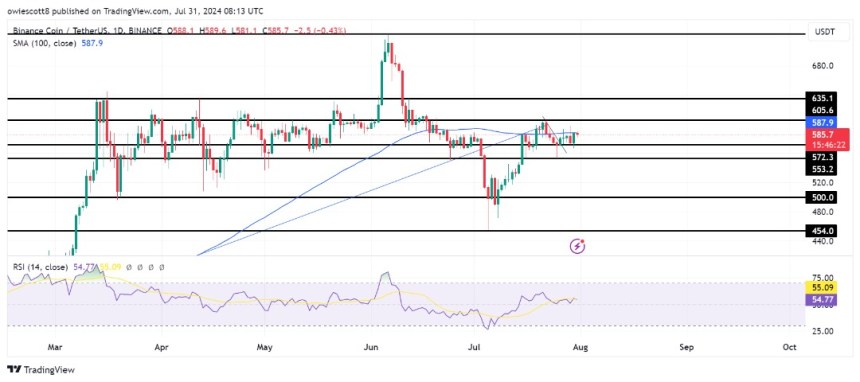
Furthermore, the RSI indicator is trading above 50%, further supporting the possibility of a bullish trend, indicating buying Busy is currently stronger than the selling pressure. The 1-day chart of BNB shows that a bullish engulfing candlestick has formed after the rejection at $572. This pattern shows a potential trend reversal and could make the $605 target attainable.

Key levels to watch as BNB reaches resistance at $605

BNB is on a bullish trajectory targeting the resistance level of $605. If the price of BNB breaks and closes above the USD 605 level, the rally could continue towards the next resistance level at USD 635 and possibly other levels above.

Nevertheless, a potential downside move could follow if the digital were to reject at $605 and fail to break above, possibly retreating to $572. The $572 level could act as a key support zone, where the price can stabilize or consolidate. However, if USD 572 does not hold, a deeper correction could take place towards lower support ranges such as USD 553.3 and USD 500.

At the time of writing, BNB’s stock is up 2.09%, trading around $585 in the past 24 hours. The cryptocurrency has a market capitalization of over $85 billion and a trading volume of over $1.8 billion, indicating an increase of 2.09% and 3.57% respectively over the same period.

BNB
BNB is trading at $587 on the 1D chart | Source: BNBUSDT on Tradingview.com

Featured image from Adobe Stock, chart from Tradingview.com

Source link

BNB breaking Key Resistance Sees
Share. Facebook Twitter Pinterest LinkedIn Tumblr Email

Related Posts

XRP’s unrealized losses soar to over $50 billion due to the oil price shock

2026-03-09

Bitcoin Price Drops Below $68,000, Downside Targets Come into Focus

2026-03-09

Bitcoin signals economic concerns as oil prices rise

2026-03-09

Ethereum Price Extends Pullback, Support at $1,920 Now Under Threat

2026-03-09
Add A Comment

Comments are closed.

Top Posts

Is a drop below $0.5 likely before October?

2023-09-23

Kraken announces a new Onchain -Crypto adjustment program for American customers two years after SEC -performance

2025-01-30

How close is BTC to a real buying zone?

2026-02-13
Editors Picks

NFT trading volume increased 230% in the first quarter, Nansen said

2023-05-10

Ethereum Adoption Skyrockets: Is the ETH price repair on the horizon?

2025-01-27

South Korea issues digital IDs secured by blockchain

2025-01-24

Our collaboration with the Global Fintech Institute

2025-03-04

Our mission is to develop a community of people who try to make financially sound decisions. The website strives to educate individuals in making wise choices about Cryptocurrencies, Defi, NFT, Metaverse and more.

We're social. Connect with us:

Facebook X (Twitter) Instagram Pinterest YouTube
Top Insights

Hedera enables 19 live transactions with the Reserve Bank of Australia

Bitcoin Reaches 20 Million Delivery Milestone as Final Coins Will Take 114 Years to Be Mined

Altcoins are approaching historic stress levels as 38% of tokens are near all-time lows

Get Informed

Subscribe to Updates

Get the latest news and Update from Bitcoin Platform about Crypto, Metaverse, NFT and more.

  • Contact
  • Terms & Conditions
  • Privacy Policy
  • DMCA
  • Advertise
© 2026 Bitcoinplatform.com - All rights reserved.

Type above and press Enter to search. Press Esc to cancel.