

XRP price gained bullish momentum above the USD 0.50 resistance zone. The price is consolidating gains and could aim for a fresh move above the USD 0.5450 resistance zone.
- The XRP price rose by more than 20% in a few days and broke the $0.500 zone.
- The price is now trading above USD 0.5050 and the 100-hourly Simple Moving Average.
- A short-term contract triangle is forming with support at $0.520 on the hourly chart of the XRP/USD pair (Kraken data source).
- The pair could extend gains if there is a close above the $0.540 resistance level.
XRP price is gaining strength
XRP price remained in a positive zone above the USD 0.440 level and extended the recovery wave. It gained more than 20% in a few days, outperforming Ethereum and Bitcoin. The price was able to climb above the USD 0.5050 and USD 0.5200 resistance levels.
The price even reached the USD 0.5450 level and peaked above USD 0.550. A high was formed at $0.5659 and the price corrected the gains. There was a small decline below the USD 0.5450 level. The price tested the $0.5150 support zone. A low was formed at $0.5140 and the price is now consolidating.
There was a move above the 23.6% Fib retracement level of the downward move from the $0.5659 swing high to the $0.5140 low. The price is now trading above $0.520 and the 100-hourly Simple Moving Average. Furthermore, a short-term contract triangle is forming with support at $0.520 on the hourly chart of the XRP/USD pair.
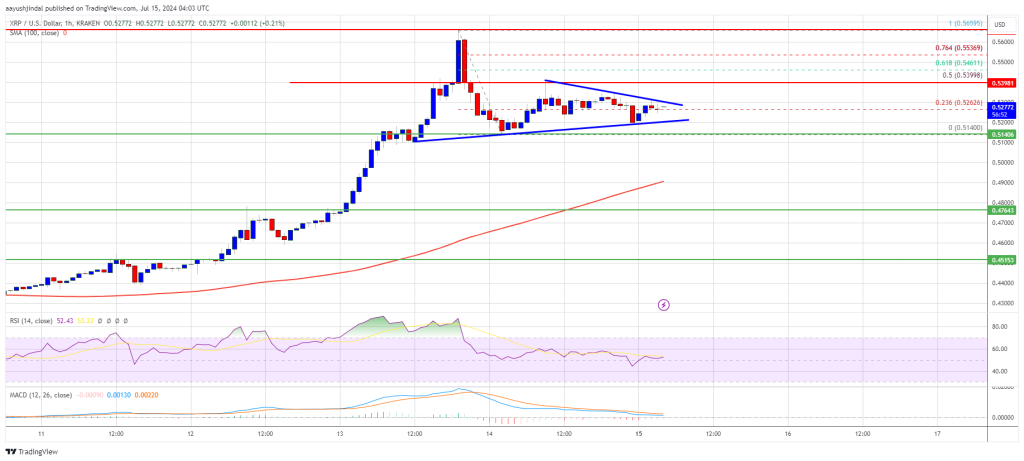
On the upside, the price is facing resistance near the $0.5290 level. The first major resistance is around the $0.5320 level. The next major resistance could be at $0.5450. A clear move above the USD 0.5450 resistance could send the price towards the USD 0.5650 resistance. The next major resistance is near the $0.5880 level. Any further gains could send the price towards the USD 0.600 resistance.
Are dips supported?
If XRP fails to break the USD 0.5450 resistance zone, a downside correction could occur. The initial downside support is near the USD 0.520 level.
The next major support is at USD 0.5150. If there is a downside break and a close below the USD 0.5150 level, the price could continue falling towards USD 0.490 in the near term.
Technical indicators
Hourly MACD – The MACD for XRP/USD is now losing pace in the bullish zone.
Hourly RSI (Relative Strength Index) – The RSI for XRP/USD is now above the 50 level.
Major support levels – USD 0.5200 and USD 0.5150.
Major resistance levels – $0.5320 and $0.5450.