

XRP price extended its rise above the $0.440 resistance zone. The price is showing positive signs and could rise further above the USD 0.4550 resistance level.
- XRP price is trying to hit a recovery wave above the $0.4400 zone.
- The price is now trading above USD 0.440 and the 100-hourly Simple Moving Average.
- A major bullish trendline is forming with support at $0.4390 on the hourly chart of the XRP/USD pair (Kraken data source).
- The pair could extend gains if there is a close above the $0.450 resistance level.
XRP price aims higher
XRP price remained in a positive zone above the USD 0.4250 level and extended its recovery wave, just like Ethereum and outperforming Bitcoin. The price was able to climb above the USD 0.4320 and USD 0.4400 resistance levels.
The price even reached the USD 0.4450 level and peaked above USD 0.450. A high was reached at $0.4547 and the price is now consolidating gains. There was a small decline below the USD 0.4450 level. The price tested the 50% Fib retracement level of the upward move from the $0.4307 swing low to the $0.4547 high.
The price is now trading above USD 0.440 and the 100-hourly Simple Moving Average. Moreover, a major bullish trendline is forming with support at $0.4390 on the hourly chart of the XRP/USD pair. The trendline is close to the 61.8% Fib retracement level of the upward move from the $0.4307 swing low to the $0.4547 high.
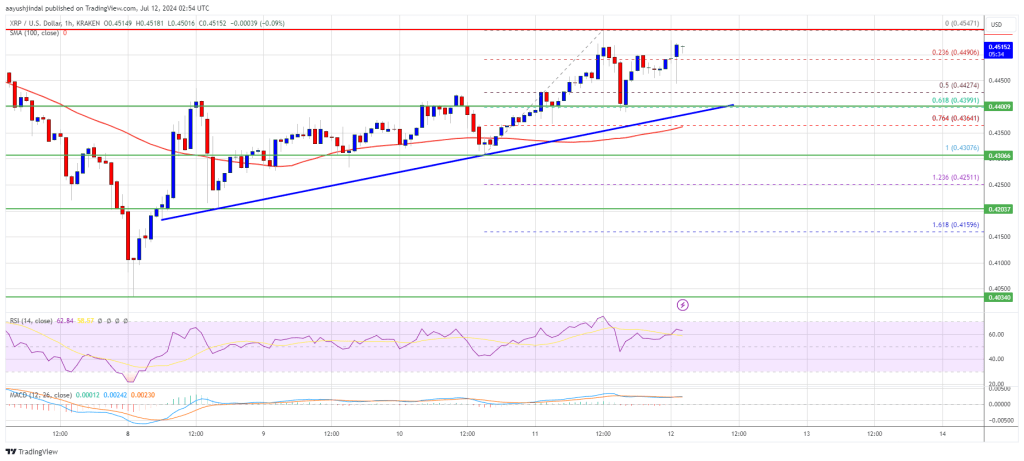
On the upside, the price is facing resistance near the $0.4550 level. The first major resistance is around the $0.4620 level. The next major resistance could be at $0.4650. A clear move above the USD 0.4650 resistance could send the price towards the USD 0.480 resistance. The next major resistance is near the $0.4880 level. Any further gains could send the price towards the USD 0.500 resistance.
Are dips supported?
If XRP fails to break the USD 0.4550 resistance zone, a downside correction could occur. The initial downside support is near the $0.4450 level.
The next major support is $0.4390 and the trendline. If there is a downside break and a close below the USD 0.4390 level, the price could continue falling towards USD 0.4220 in the near term.
Technical indicators
Hourly MACD – The MACD for XRP/USD is now gaining speed in the bullish zone.
Hourly RSI (Relative Strength Index) – The RSI for XRP/USD is now above the 50 level.
Major support levels – $0.4450 and $0.4390.
Major resistance levels – $0.4550 and $0.4800.