

Data from Santiment shows this bearish sentiment language is flooding social media at peak levels. However, this could be a good thing for smart, bullish investors, as the sentiment data suggests that what retail traders say may be a the opposite price movement.
Fear on social media shows fading bullish language
Data from Santiment The social dominance tracking tool shows a vivid rise in bearish language dominates Bitcoin-related discussions on social media platforms. Terms such as ‘crash’, ‘dip’, ‘pullback’ and ‘carnage’ are now appears more often on social platforms, and this is a direct reflection of the fear among retail participants. Santiment’s social dominance tracking tool monitors the balance between bullish and bearish language on crypto-related social media in real time.
Related reading
At the same time, optimistic statements about rallies, such as ‘buying’, ‘accumulation’ or ‘mooning’ have faded into the background. As bearish as this may sound, history shows that this imbalance between fear and greed has always been associated with turning points for crypto prices.
As of late March 2026, Santiment’s chart shows a resurgence of fear language, with the metric marking the current moment as a zone similar to previous buy signals highlighted over the past thirteen months.
Each of these previous signals, shown in the chart below and visible in February, April, August, October, and November 2025, preceded meaningful upward moves in Bitcoin’s price action.
On the other hand, each major Santiment-highlighted ‘Sell’ signal where the bullish language peaked corresponded with local price spikes. The most prominent of these occurred in late November 2025 and again in mid-January 2026, both of which were followed by price crashes.
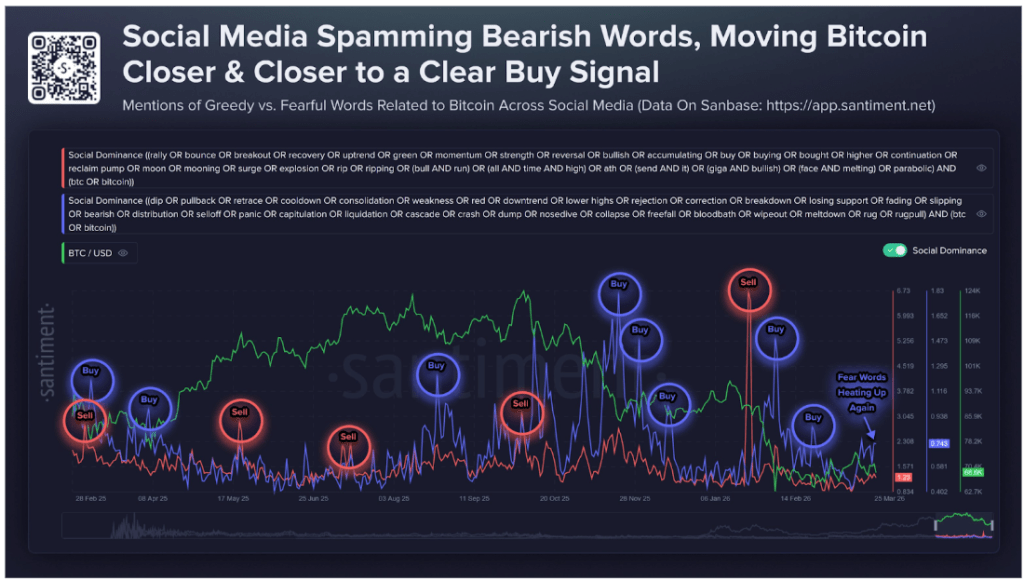
Crypto sentiment on social media. Source: Santiment Op
Bitcoin network activity tells a more complicated story
However, price alone may not be enough to confirm a sustainable bottom. CryptoQuant data Bitcoin active addresses introduces an important caveat: Network participation has declined by more than 30% from its peak in August 2025.
During the height of Bitcoin’s bull run in August 2025, active addresses reached 938,609 in one day, while the 30-day moving average was above 743,000. However, the number of daily active addresses dropped to 655,908 at the end of March, with the seven-day moving average now around 613,000 and the 30-day average at 636,000.
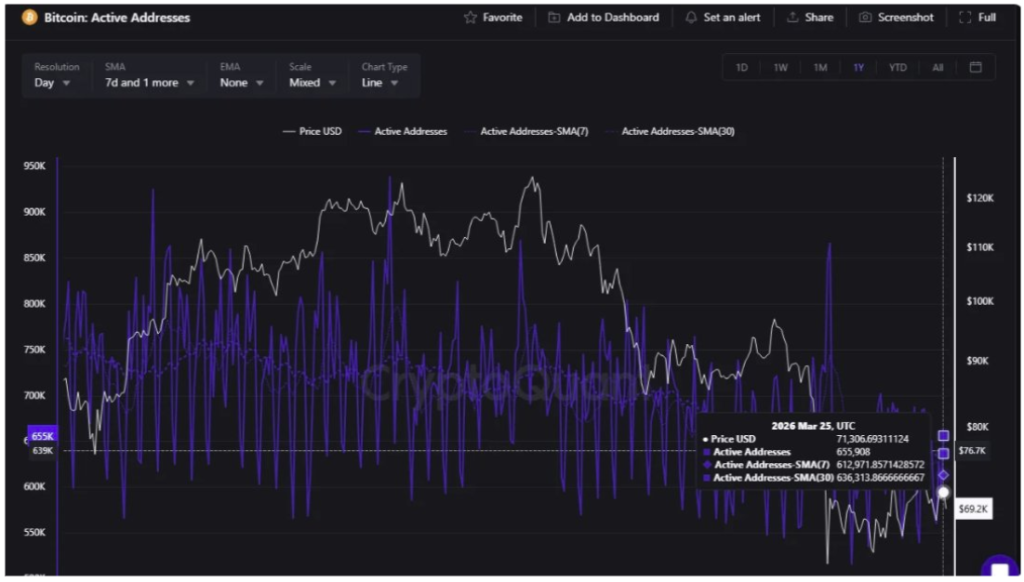
Bitcoin active addresses. Source: CryptoQuant
This cooling down in activity means fewer participants are actively transacting on the Bitcoin blockchain network. This is another reflection of the lack of bullish price action. lack of investor involvement, and a prolonged consolidation phase.
Related reading
According to a crypto analyst on the CryptoQuant platform, a price recovery in itself may not happen enough to validate a convincing structural recovery. Active participants, wallets that transact, move coins and interact with the network at scale, will also be necessary for any structural recovery.
Featured image from Unsplash, chart from TradingView