

Gold has entered bear market territory after giving up its year-to-date gains even as US Bitcoin exchange-traded funds (ETFs) continued to attract fresh money, pushing the two assets onto sharply different paths.
According to goldprice.org, spot gold traded around $4,388 per ounce on March 23, down about 22% from the record high of $5,594.82 on January 29. The decline accelerated after the latest conflict in the Middle East began on February 28. Since then, gold has fallen about 17%, reversing the rally that had lifted gold in the early weeks of 2026.
At the same time, institutional money continued to flow into the US spot Bitcoin ETF market. Data from Farside Investors shows that the funds received approximately $2.42 billion in net inflows in the four calendar weeks ending March 20.
The difference has drawn attention in the macro and digital asset markets as gold and Bitcoin are often discussed in similar terms during periods marked by inflation concerns, currency dilution and geopolitical tension.
However, over the past month, investors treated them very differently. Gold faced liquidation pressure as demand for cash increased and interest rate expectations remained high. Bitcoin continued to attract allocations through brokerage and advisory channels through the ETF structure.
This move is also notable because gold entered 2026 with strong momentum. The pullback now meets the commonly used market definition of a bear market: a decline of 20% or more from a recent peak. Bitcoin, on the other hand, has held up well enough to keep ETF buyers engaged during the same period of volatility.
Gold is giving back early-year gains as interest rates remain high and investors raise money
Gold’s decline occurred against a macroeconomic backdrop that has become less supportive of assets that typically benefit from lower rates and a softer dollar.
The Federal Reserve held rates steady in March, predicting rates would reach 3.4% at the end of 2026, while core personal consumption inflation remained at 2.7%. This combination reinforced views that policies could remain restrictive for longer than investors expected earlier this year.
For precious metals the effect is immediate. Higher interest rates increase the opportunity cost of holding an unprofitable asset. A stronger dollar increases pressure by making gold more expensive for buyers using other currencies.
These forces increased as investors also sought cash and liquidity after the Middle East shock forced a repricing of growth, inflation and energy expectations.
Money flow data showed the shift quickly. LSEG Lipper data showed Global gold and precious metals funds posted about $5.19 billion in weekly net outflows through March 18, the biggest weekly retreat since at least August 2018. In the same week, money market funds took in $32.57 billion.
This rotation signals that investors have been moving toward liquidity and moving away from positions that had benefited from past inflation and the demand for geopolitical hedging.
Gold’s decline is therefore part of a broader portfolio adjustment, where maintaining flexibility became more important as markets reassessed the likely path of monetary policy and commodity prices.
The sell-off also came after a period when gold’s long-term support appeared solid. Central bank demand had helped support the bullion market through 2025, and the reserve remained intact as 2026 began.
The recent decline shows how powerful short-term macroeconomic conditions can overwhelm that structural support within weeks.
Other fund data points in the same direction. The largest US gold-backed ETF, SPDR Gold Shares (GLD), recorded outflows of $7.07 billion in March, according to market data.
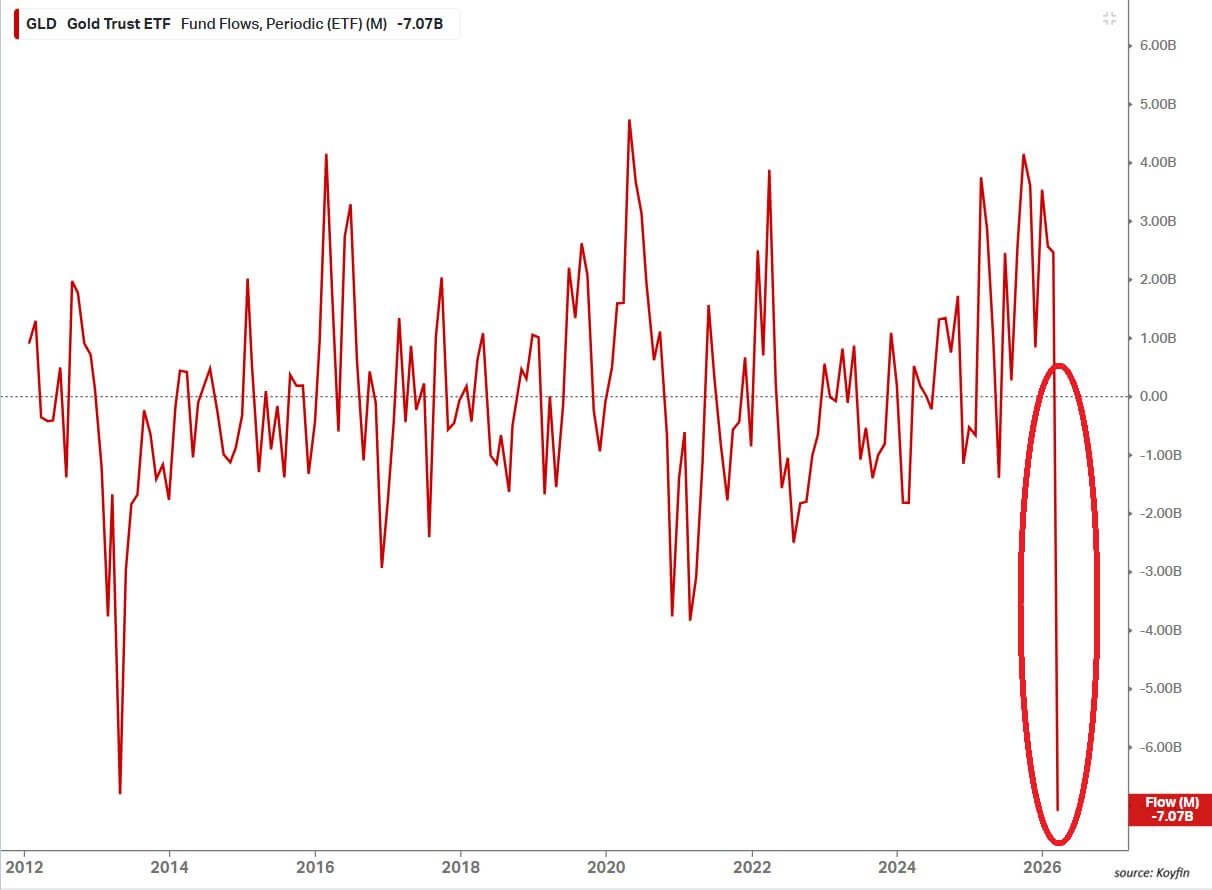
That surpassed the previous record monthly withdrawal of $6.8 billion in April 2013. The pace of redemption reflected the speed of the turnaround in investor positioning after gold soared higher earlier this year.
By the metric used in financial markets, a 22% decline from the January peak marks a clear transition into bear market territory.
Gold’s decline therefore represents more than a routine pullback after a rally. It signals a broad retreat from a trade that was supported by reserve accumulation, geopolitical hedging and concerns about the persistence of inflation.
Bitcoin funds extend their strongest inflows of 2026
While gold lost ground, US listed Bitcoin funds saw their strongest inflows this year.
Farside data shows that the 12 US spot Bitcoin funds recorded four consecutive weeks of net inflows, adding more than $2 billion in value during that period. It’s the longest stretch in 2026 and the strongest since August and September 2025, when the funds absorbed more than $3.8 billion.
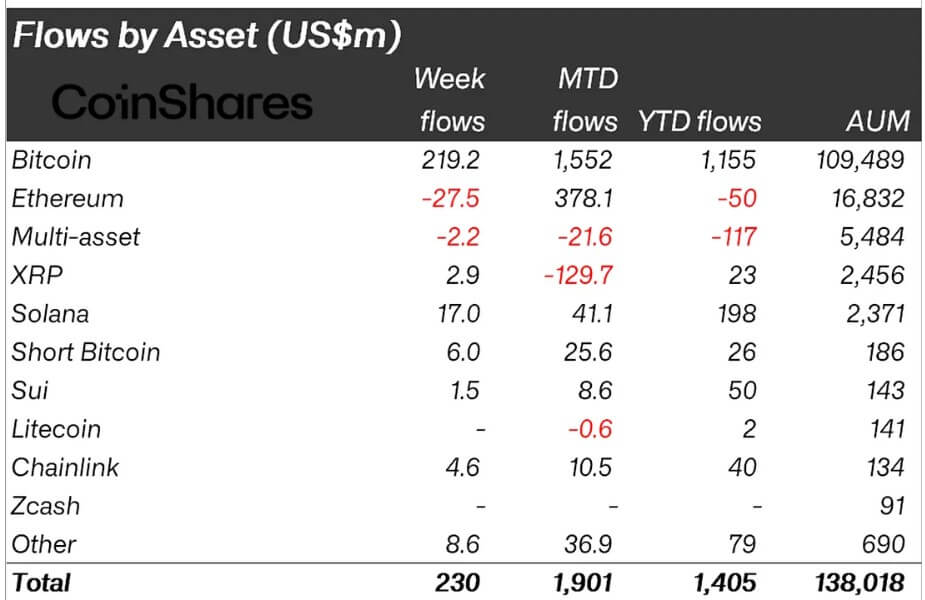
Coin shares facts show a similar trend worldwide. The company said Bitcoin exchange-traded products have recorded $1.5 billion in inflows so far this month.
These inflows occurred at a time of war risks, shifting expectations for U.S. interest rates, and renewed commodity volatility. Even against that backdrop, institutions continued to use the ETF wrapper to increase or maintain exposure to Bitcoin, while gold funds experienced large redemptions.
Last week, Bitwise said Bitcoin and other major crypto assets have outperformed US stocks and gold since early March.
The asset manager said the move could signal the early stages of a rotation, while also cautioning that recent price action could reflect temporary volatility or isolated liquidity events. Bitwise added that gold has historically been four to seven months ahead of Bitcoin.
State Street Global Advisors outlined the volatility gap in the March gold monitor. Over a ten-year period, Bitcoin’s 30-day rolling volatility averaged about 52.0, compared to 13.6 for gold.
From January 2016 through February 2026, Bitcoin recorded 30 months of losses of more than 8%, while gold recorded one such month, according to the report.
These numbers show the type of exposure investors took through Bitcoin ETFs. Buyers accepted bigger swings and deeper declines in exchange for access to an asset that some investors view as a hedge against fiat dilution and policy risks.
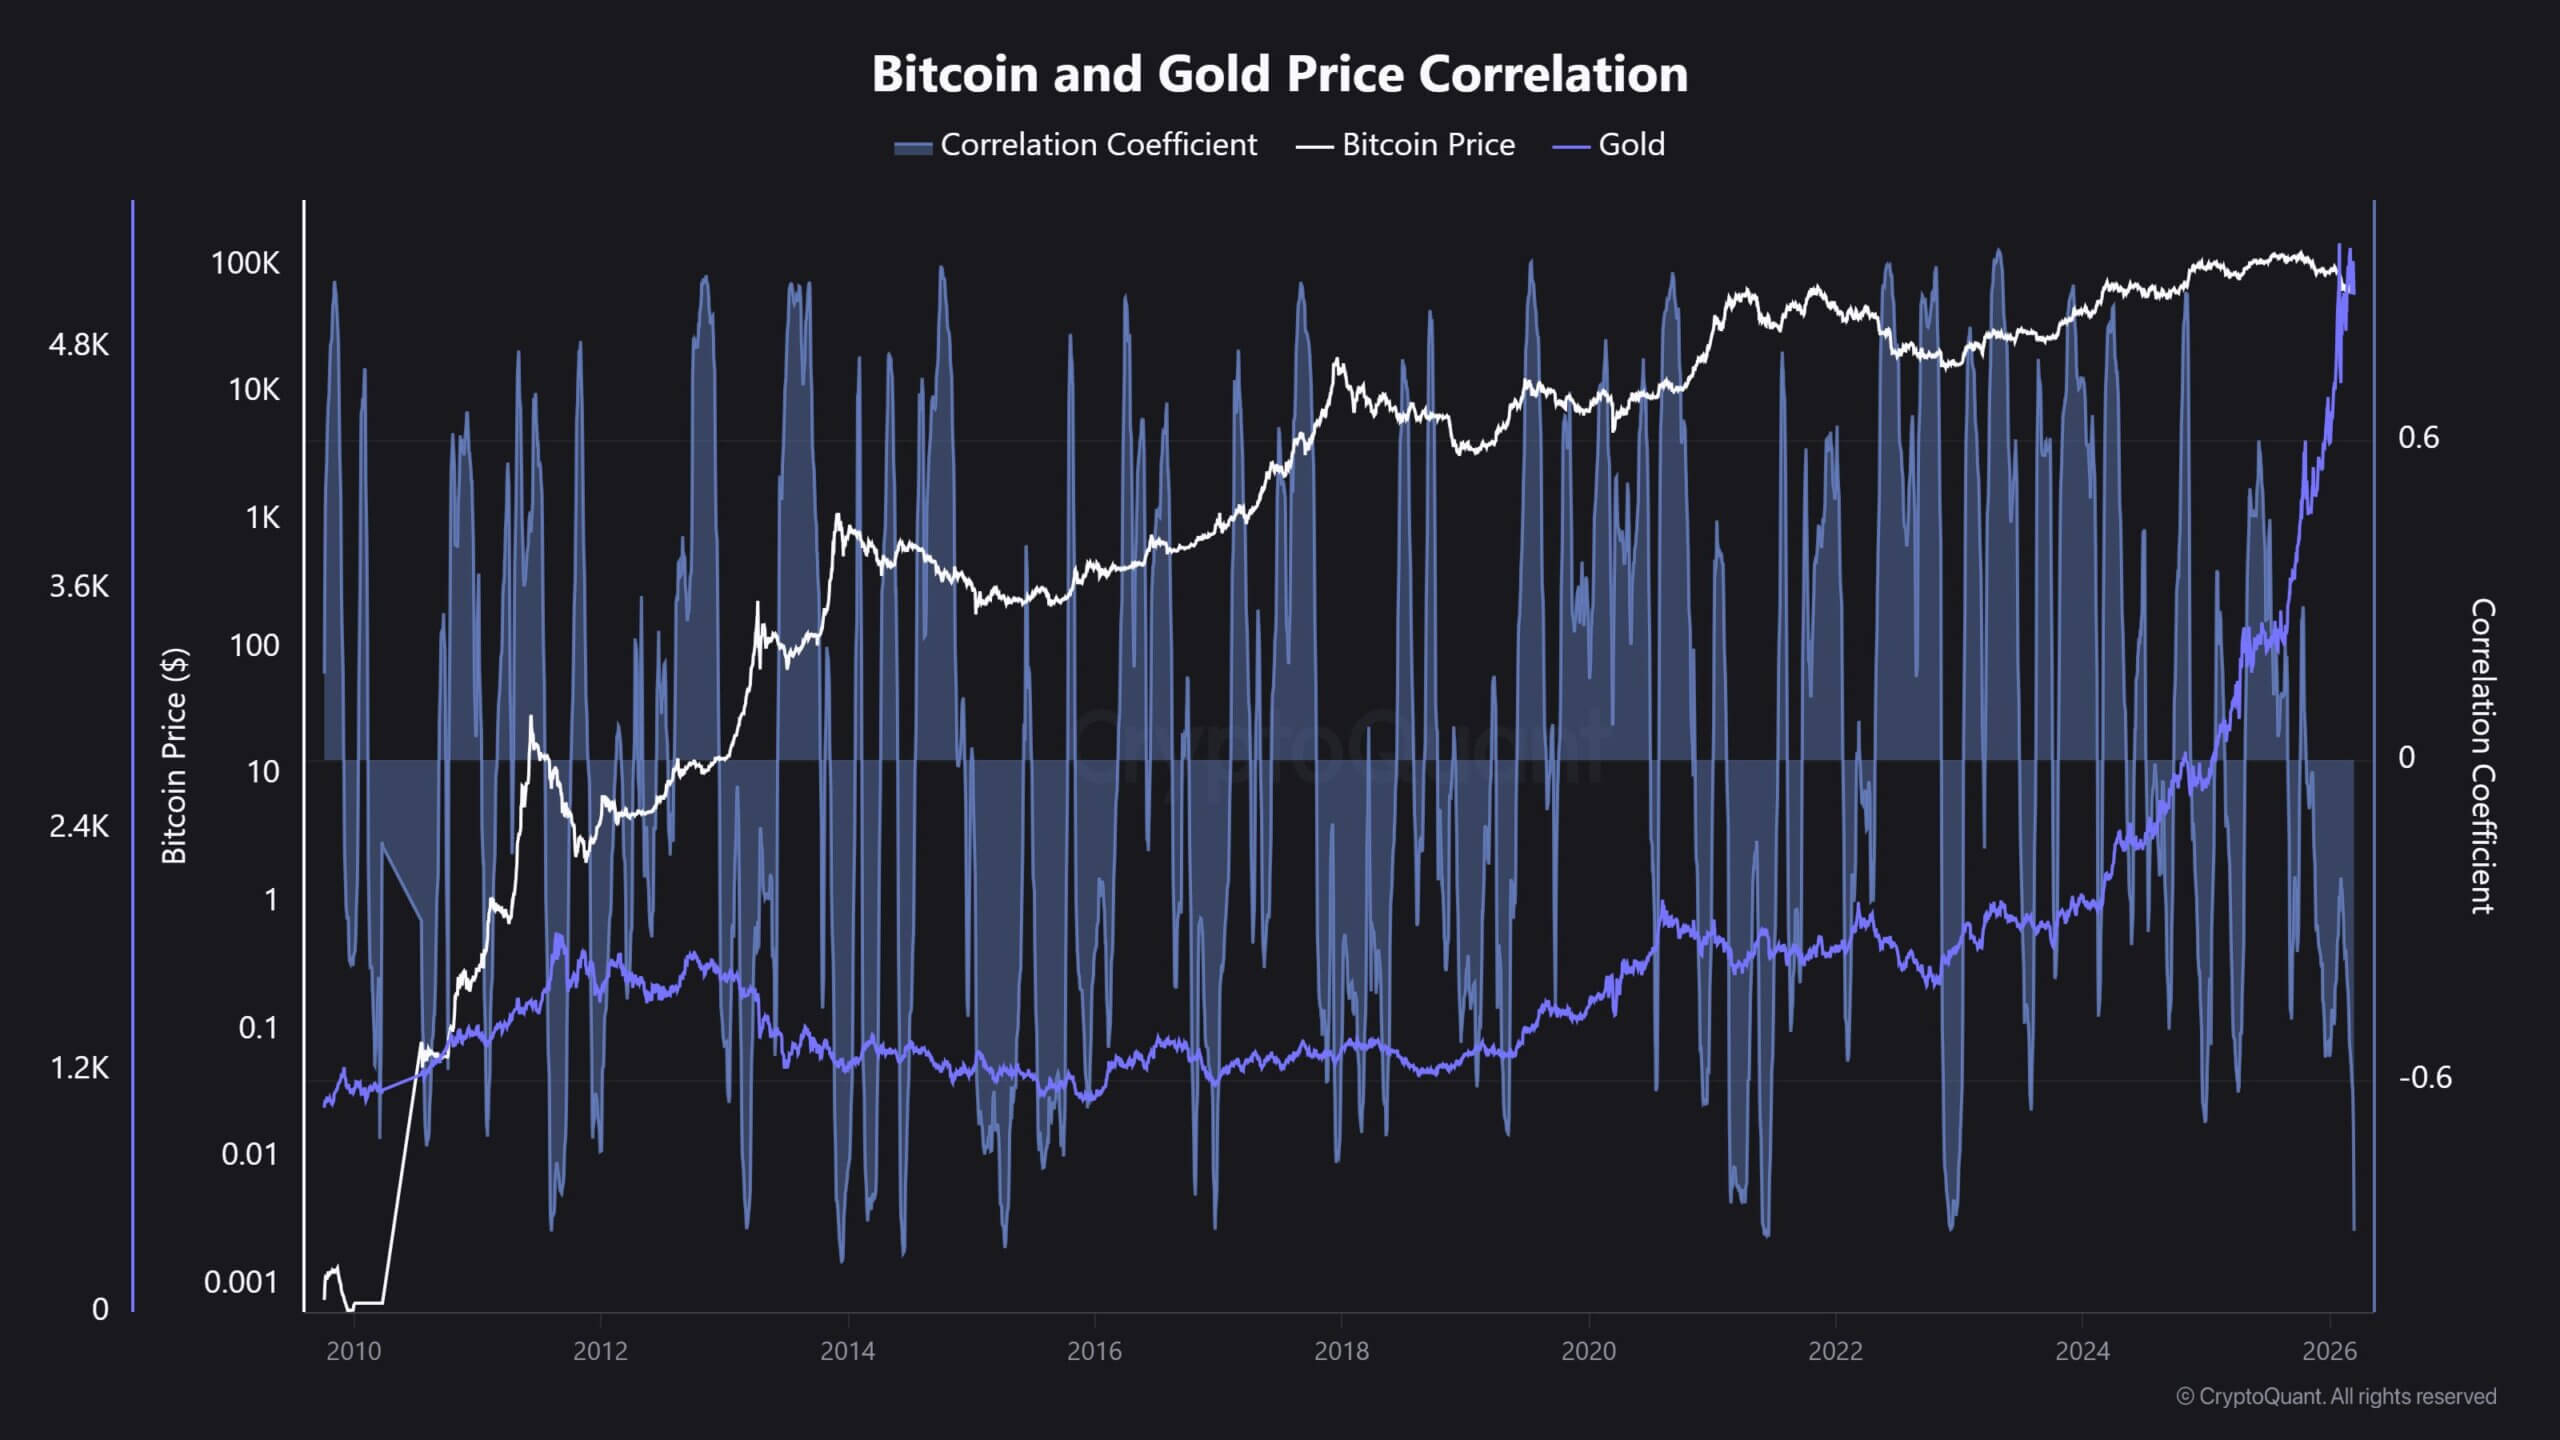
CryptoQuant data also shows how far apart the two assets are. The company said the correlation between Bitcoin and gold fell to minus 0.88, the lowest reading since November 2022, indicating the two assets moved in opposite directions with unusual force over the period measured.
Oil and interest rates could determine the next phase
The longer-term support for gold hasn’t disappeared even after the March sell-off, and that’s part of why the current gap between gold and Bitcoin is being more closely watched.
The World Gold Council said Total gold demand, including over-the-counter activities, exceeded 5,000 tons for the first time in 2025. Gold ETF shares rose 801 tons last year, and central banks bought 863 tons. In February 2026 alone, physically backed gold ETFs brought in $5.3 billion globally.
These figures show that demand for official sector purchases and long-term investments remained strong heading into this quarter.
The current pullback therefore has investors balancing two forces: short-term macro pressures from interest rates, dollar strength and liquidity demand, and a bid for structural reserves that remained in place last year and into early 2026.
Oil prices can play a central role in how that equilibrium develops. Several banks have upgraded their Brent forecasts for 2026 following the latest shock in the Middle East. Bank of America raised its forecast to $77.50 per barrel, while Standard Chartered raised its forecast to $85.50. Bank of America also outlined an upward trajectory towards $130 in the event of a prolonged supply-side disruption.
Higher oil prices would fuel inflation expectations and could keep the Federal Reserve cautious for longer. That would affect gold and Bitcoin through different channels.
Gold would remain under pressure from high real interest rates and the strong dollar if policies remain restrictive. Bitcoin would remain more closely tied to liquidity conditions, institutional risk appetite, and the willingness of ETF buyers to continue adding exposure through regulated products.
For now, the clearest market signal is the split itself. Gold, long treated as a traditional store of value during periods of stress, has entered a bear market after falling more than 20% from its January high. Bitcoin, an asset more often associated with greater price swings, has continued to collect ETF inflows over the same period.