

Bitcoin price dipping below $78,000 has shifted the market’s attention to whether buyers can defend the $76,000 area or if the pullback opens the way for a deeper move towards $70,000.
Crypto market maker Wintermute said the latest drop followed another rejection near $82,000 as Bitcoin struggled to reclaim its 200-day moving average.
The move has turned what seemed like a routine consolidation after a $60,000 rally into a broader test of market depth, institutional demand and short-term holders’ conviction.
That makes the $76,000 area the immediate Bitcoin support level to watch.
Inflation and yields weaken the case for risky assets
BTC’s sudden shift in market behavior stems directly from a deteriorating macroeconomic environment that has forced a major repricing of all risk-sensitive asset classes.
CryptoSlate previously reported that April’s consumer price index (CPI) came in warmer than expected, with headline inflation at 3.8% annualized, versus a consensus estimate of 3.7%.
This acceleration, coupled with the fact that vital global shipping lanes remain closed, signals that the energy shock has evolved from a temporary supply chain bottleneck to a persistent economic headwind.
The immediate consequences are visible in the real economy, where US real wages have turned negative for the first time in three years, undermining consumer purchasing power.
At the same time, US fixed income markets reacted to inflation rates with extreme volatility, directly undermining the investment thesis for non-yielding digital assets.
CryptoSlate previously reported that the yield on ten-year US government bonds rose to 4.58%, the highest level since September 2025.
This move forced an aggressive recalibration of expectations for Federal Reserve policy. Federal funds futures have completely wiped out previously expected rate cuts for 2026, and the market now estimates a 44% probability of a rate hike in December, up from 22.5% just a week ago.
Wintermute stated that over the past five trading days, the conversation between trading desks has shifted from “when are they going to cut” to “are they walking.”
Meanwhile, this rapidly changing environment coincided with the narrow Senate confirmation of Kevin Warsh as the new chairman of the Federal Reserve.
Wintermute noted that Warsh gives the central bank a historically hawkish reputation ahead of the crucial June 16-17 FOMC meeting, where a new dot chart and an updated Summary of Economic Projections (SEP) will be released.
With interest rates rising, the Empire State Manufacturing Index rising to 19.6 against expectations of 7.0, and prices accelerating, higher inflation and rising interest rates are reducing the appeal of duration-sensitive assets.
Bitcoin is losing the support that carried the rally
Meanwhile, Bitcoin’s push towards $82,000 stalled at the level traders needed to claw back to confirm a stronger recovery.
Wintermute said the asset broke near $82,200, about where the 200-day moving average is. Bitcoin has been rejected around that moving average five times this month, making it a clear technical ceiling for spot buyers.
These repeated failures showed that the rally had not yet developed the depth needed to go beyond a momentum trade. Instead, the market remained heavily dependent on derivative positioning and short covering.
Data from CryptoQuant reinforced that view, showing that Bitcoin’s advance in April was accompanied by a sharp increase in leverage. The analytics platform said:
“Bitcoin’s rally toward $80,000 fueled the fastest growth in BTC perpetual futures open interest yet in 2026.”
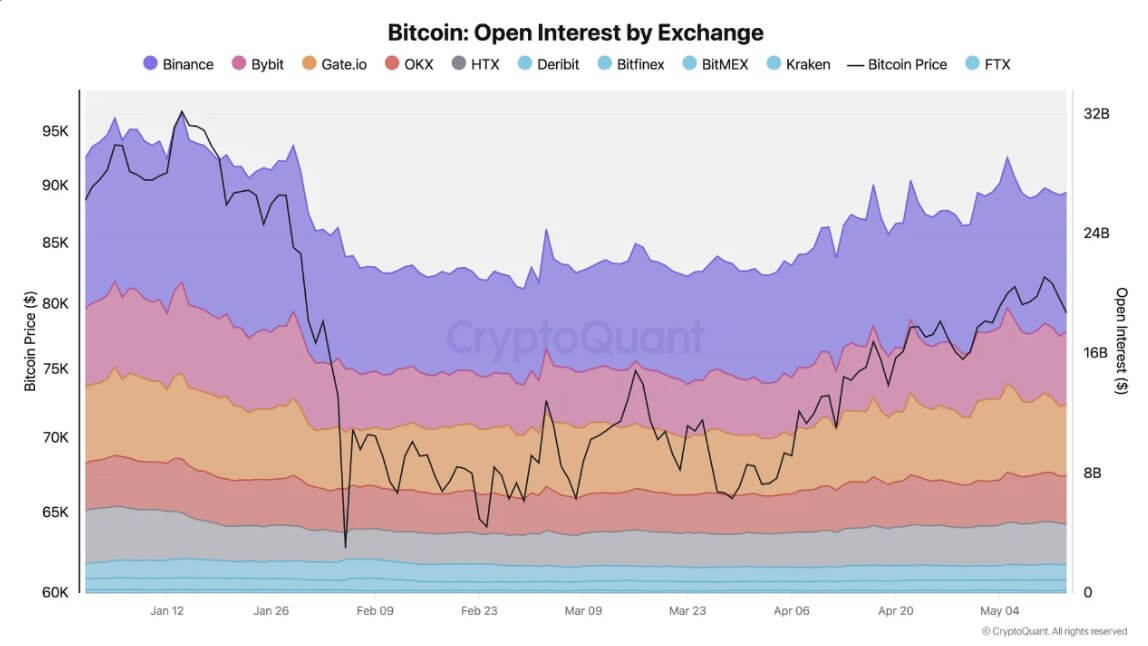
This build-up pushed prices higher as sentiment improved, but also left the market vulnerable once conditions turned.
At the same time, Bitcoin ETF outflows weakened institutional demand as the products ended a six-week influx. Spot Bitcoin ETFs recorded net outflows of $1 billion last week, their worst weekly performance since January.
Glassnode said institutions used the previous move above $80,000 to profit, with the seven-day simple moving average of net ETF flows falling to -$88 million per day, the lowest since mid-February.
That left leveraged traders capturing more of the market’s upward momentum as the spot bid faded. Once the macro pressures arrived, Bitcoin was unable to hold the levels that would have signaled stronger underlying demand.
The change took place quickly through the derivatives markets. Wintermute noted that BTC’s decline to $76,800 over the weekend led to $657 million in liquidations across the major exchanges, with long positions accounting for around $584 million of the forced sales.
Ultimately, this sequence showed why the rejection of almost $82,000 was important. Bitcoin didn’t simply fail at resistance; it lost support from the same leverage-driven structure that had taken the rally to new heights.

Long-term holders ensure that the bearish case does not prevail
Despite the negative price action and institutional outflows, the underlying on-chain metrics provide a strong counterargument to the immediate bearish thesis.
In a note shared with CryptoSlatecrypto exchange CEX.io noted that BTC supply from dedicated holders remains limited, keeping the network’s structural framework intact, while short-term holders and ETF investors currently set the price on a margin.
According to the company, long-term committed Bitcoin holders added approximately 80,000 BTC to their wallets over the past seven days, extending a multi-month accumulation pattern.
This cohort has maintained its purchasing program even as a growing portion of its recent acquisitions find themselves in a position of unrealized losses, a sign of deep structural conviction rather than short-term speculation.
CEX.io noted that the lack of capitulation among core network participants is reflected in the risk ratio on the sell side of the market, which has fallen to the lowest level since October 2023.
This low sell-side risk ratio indicates that long-term holders feel little urgency to realize gains or reduce losses at current valuations, leaving foreign exchange reserves at multi-year lows.
Historically, however, similarly low sell-side risk ratios have often preceded sharp price moves in either direction in the short term.
However, because the Bitcoin Days Destroyed (BCDD) metric points to an increase in inactivity among long-term holders while short-term holders currently dominate Bitcoin selling, this dynamic could temporarily support bearish momentum.
The thinned liquidity environment allows short-term marginal sellers to exert outsized influence on spot prices before the broader long-term trend can resume.
What’s next for Bitcoin?
Against this market backdrop, Bitcoin is now near the level that could determine whether the pullback remains under control.
The top digital asset is currently trading below $78,000, an area related to the short-term cost basis for the holder and the true average price of the market. When Bitcoin trades below that zone, more recent buyers suffer losses, increasing the risk that some of them sell into weakness.
CEX.io noted that the next level to watch is $76,250, which matches the 0.236 Fibonacci retracement of Bitcoin’s all-time high. If buyers defend that territory and Bitcoin regains $78,000, the market could regain enough confidence to retest $80,000.
The exchange stated that a sustained move above that level would ease pressure on short-term holders and could reopen a path to $85,750.
That leaves the Bitcoin price outlook dependent on whether buyers can reclaim $78,000 or lose the $76,000 support zone.
If $76,000 fails, the scheme becomes more vulnerable. A break below $75,000, combined with continued ETF outflows and an uncertain macro environment, would increase Bitcoin risk at $70,000.