

XRP is trade in a quiet range between $1.38 and $1.40, but new derivatives data indicates the calm may be masking a more volatile situation beneath the surface.
A CryptoQuant analysis from Pelinay shows that XRP’s leverage structure is low and moving sideways, while price action has been relatively higher than leverage, and this has created a difference that history shows can be resolved by a powerful explosive movement.
Related reading
XRP remains strong despite sharp decline in leverage ratio
The CryptoQuant chart shared by Pelinay focuses on Binance’s estimated leverage ratio for XRP. The main signal the chart shows is not only that leverage is low, but that the price of XRP has not collapsed at the same time.
The chart shows that leverage was much higher in previous phases, especially around the big price increases in late 2024 and the push to new all-time highs in mid-2025. However, the current leverage ratio has fallen back to the bottom of its range and is moving sideways.
The The leverage is now back to normal figures from the end of 2024. In particular, the estimated leverage ratio on Binance is now around 0.1. However, the XRP price is still around $1.4, which is well above the pre-breakout price level in late 2024. In October 2024, a leverage ratio of 0.1 corresponded to an
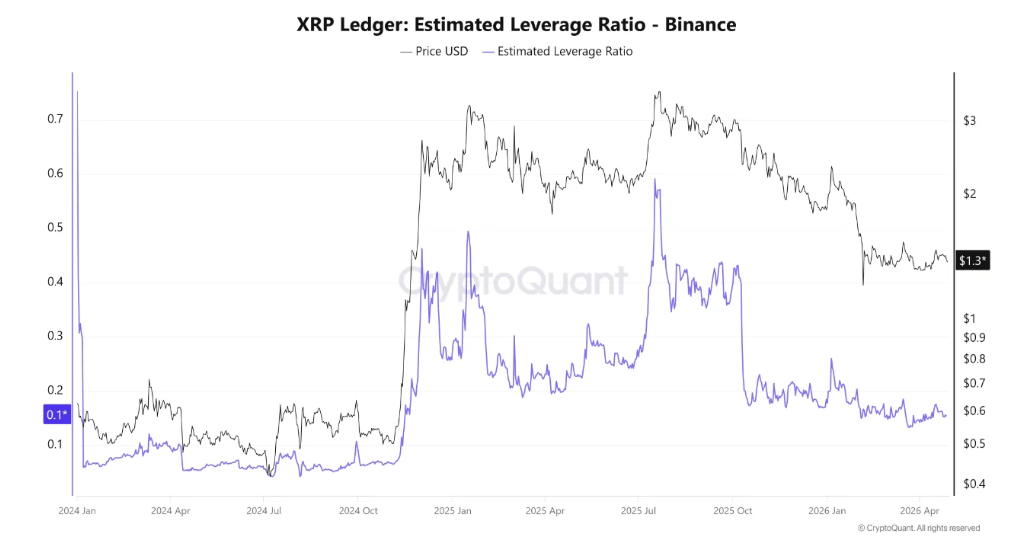
XRP estimated leverage ratio on Binance. Source: CryptoQuant
Will there be a squeeze on XRP?
What this essentially means is that the XRP price is no longer being pushed mainly through aggressive borrowed positioning. That could be important because it suggests that much of the excess speculation has already been washed away.
However, these types of disagreements rarely remain unresolved for long. The market usually deals with it in two ways. Price can fall to match the lower leverage environment, or leverage could start to rise again and fuel a stronger price reaction.
The second outcome is the more bullish scenario. In that case, XRP would not need an already overheated derivatives market to begin its move. A similar move occurred between late June and mid-July 2025, when the leverage ratio rose from under 0.3 to just under 0.6 in four weeks, and during the same period XRP rose from $1.96 to $3.65.
Related reading
Crypto analyst Egrag Crypto came to a similar one conclusion through a completely different framework using the monthly candlestick timetable. Both analyzes point to the same idea: XRP may look calm, but its structure is preparing for a violent move.
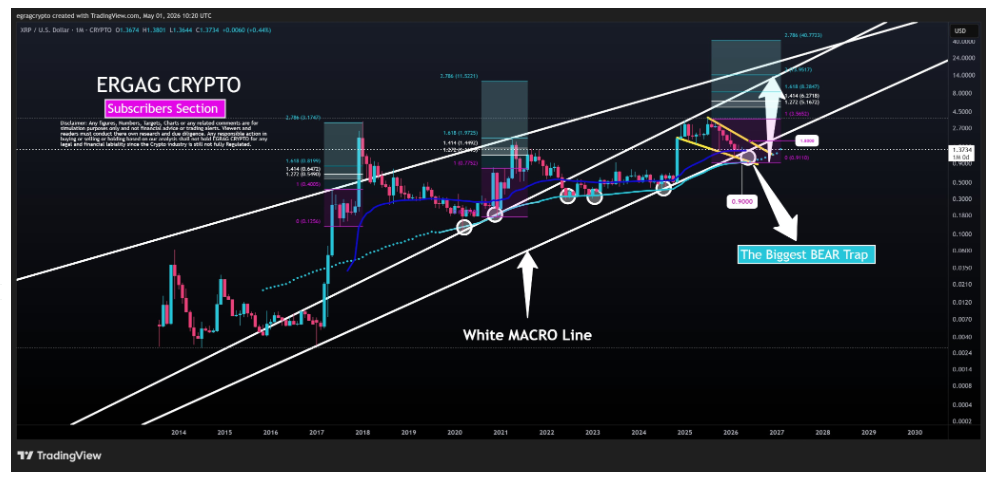
XRP price chart. Source: @egragcrypto
The chart shows XRP compressed between rising long-term macro lines, with the price now around the lower part of a wedge structure. EGRAG highlighted the $0.90 region as a possible fall zone, while also showing a bullish path that could send XRP back above $1.80.
Featured image from Unsplash, chart from TradingView